Selected work

Every claim here carries its evidence.

12 case studies, 75 metrics, 18 interface screenshots. Numbers are labelled by how they were derived — measured, computed from the artifact, estimated, or reported — and every estimate shows its arithmetic. Where the source is private, it says so rather than linking somewhere you cannot go.

4

independent MCP servers

A four-server MCP ecosystem for an analytics platform

Four Model Context Protocol servers that let an AI agent operate, explain, and reason about a production analytics platform — with the write-safety architecture that makes that survivable. All four are open source and readable.

Public sourceSole architect and engineer · 202611 metricssee the proof ▾

Offered as proof of: Systems architecture under real safety constraints: separating concerns across services, designing tool surfaces a model can choose from reliably, and gating destructive operations by risk domain.

  • TypeScript
  • Node 20+
  • MCP (stdio)
  • REST
  • git
  • Zod

How it works

builderstylistresponsivedebuggercode gateadversaryvisual gatebrowseradvisorshipblocking → debugger, ≤2 roundssame again, bounded separatelyBoth gates are read-only: no create, update, delete or bind in their tool grant.Each finding must show its mechanism; an unreproducible one is downgraded, not inflated.Still blocked after two rounds? It surfaces the findings rather than shipping.
Six specialists with a bounded adversarial gate
Agent asksnatural languageEndpoint allowlist11 reads, hard-codedPortal enforcesgroups + row-level securityOnly what that useris permitted to seeNo tool in the server can create, modify or delete. The restriction is structural, not prompt-based.
The portal enforces permissions, not the model

I split one obvious server into four, because a tool surface a model can choose from reliably is worth more than a tool surface that can do everything.

4 items you can open and check yourself

4independent MCP servers

Each server owns one job. An analyst-facing agent can be handed the catalog without also being handed delete_job.

Computed from source
How this was derived
What this basis means
Derived by counting the artifact itself — files, lines, checks, assets. Reproducible by anyone with repository access.
Working
Counted from the four repositories and their published README architecture sections.
As of
2026-08-06
11endpoints on the read-only allowlist

Nine reads and two read-semantic posts — execute a saved query, sample rows. There is no write endpoint on the list at all. The client refuses anything outside it before a request is ever made, so the restriction is structural rather than prompt-based.

Computed from source
How this was derived
What this basis means
Derived by counting the artifact itself — files, lines, checks, assets. Reproducible by anyone with repository access.
Working
Counted from the API_ALLOWLIST constant in the chat server’s portal client. The server reports 12 because its transparency call prepends the login endpoint, which is issued directly rather than through the guarded request path.
As of
2026-08-06
137tools across the four servers

Forty on the portal server, forty-five registered on the runner, thirty-one on the catalog, twenty-one read-only on the chat server. Five of the runner’s only register at all when a write domain is explicitly enabled.

Computed from source
How this was derived
What this basis means
Derived by counting the artifact itself — files, lines, checks, assets. Reproducible by anyone with repository access.
Working
Counted registerTool call sites in src across each repository, excluding tests. Cross-checked against each generated tools reference.
Caveat
The runner’s own README documents 36 by default and up to 41 with every write domain enabled; the 45 figure counts every registration site in source, including the four lineage tools. Quoted here as registered-in-source.
As of
2026-08-06
1,327test cases across 108 test files

Agent tooling that can write to production needs its guards tested, not asserted. This is the counterweight to every safety claim on this page.

Computed from source
How this was derived
What this basis means
Derived by counting the artifact itself — files, lines, checks, assets. Reproducible by anyone with repository access.
Working
Counted declared it/test cases across the four repositories: portal 374, runner 268, catalog 627, chat 58.
Caveat
A static count of declared cases, not the result of a green test run.
As of
2026-08-06
Evidence
  • Authors validated HTML blocks, builds pages, manages data sources, queries, themes and users. Mirrors every content write to a git repo so any change can be reverted.

  • Operates the ETL platform — jobs, sequences, run history, credentials, files, webhooks — and builds a durable semantic model with an approval lifecycle.

  • Strictly read-only sibling. Answers questions about a portal through the lens of the authenticated user’s permissions, groups, and row-level security. No tool in the server can create, modify, or delete anything.

  • The semantic layer: data dictionary, profiling, and job/data lineage. Answers "what does this data mean and how much should I trust it" — and deliberately nothing else.

Where it applied
  • An analyst asks a chat assistant where a revenue number on a dashboard comes from, and gets an answer scoped to what that specific user is permitted to see.
  • An implementation engineer describes a dashboard in natural language; the agent discovers data sources, writes a saved query, authors a validated block, and places it on a page.
  • An operator runs a zero-mutation audit session against a production ETL instance with a single environment variable.
What it implies

I design for the failure mode, not the demo. Splitting by job-to-be-done keeps each tool surface small enough for a model to choose well from, and keeps destructive capability out of contexts that never need it.
Every write passes a risk-domain gate before it reaches the platform, and every content write is mirrored to git so it can be reverted.

3independently gated risk domains

Jobs, data, and admin each require their own explicit opt-in. Enabling one does not enable the others.

Computed from source
How this was derived
What this basis means
Derived by counting the artifact itself — files, lines, checks, assets. Reproducible by anyone with repository access.
Working
Counted from the documented environment variables ALLOW_DELETE_JOBS, ALLOW_DATA_WRITES, and ALLOW_ADMIN_WRITES.
As of
2026-08-06
Evidence
  • artifactLayered safety gatesnot public

    Writes are tagged with a risk domain and pass write-domain, structure, reference-integrity, impact, and SQL gates before any request is issued.

    Employer intellectual property.

  • artifactPer-domain environment gatingnot public

    Destructive capability is off by default and enabled per domain — jobs, data, admin — with a master read-only switch above all of them. Only the browser setup UI can write the safety block, so an agent cannot grant itself permissions.

    Employer intellectual property.

  • artifactGit-mirrored, revertible writesnot public

    Successful content writes are mirrored to a git repository, giving snapshot, history, diff, and restore operations over a system that has no native version control.

    Employer intellectual property.

Where it applied
  • An agent proposes a schema-affecting change; the impact gate surfaces what it would break before anything executes.
  • A block edit goes wrong in production and is reverted from git history rather than rebuilt from memory.
What it implies

I treat an AI agent as an untrusted caller with useful judgment. The interesting engineering in agent tooling is not the tools — it is the boundary around them.

I automated a deprecation migration that had to be repeated across more than forty production portals by hand.

40+production portals requiring migration

The same breaking change, repeated once per portal. Repetition at this scale is what made it worth automating rather than grinding through.

Reported
How this was derived
What this basis means
Taken from professional record or supplied by a client, employer, or colleague, rather than measured independently here. The source of each reported figure is named in its caveat.
Working
Count of production portals carrying the deprecated API version at the time of the migration.
Caveat
Internal observation from inside the engineering team — not a client figure.
Who can confirm
Zuar engineering colleagues can confirm the estate size.
As of
2026-08-06
~40working hours per manual migration

Elapsed time ran up to three weeks per portal once review and coordination were included.

Reported
How this was derived
What this basis means
Taken from professional record or supplied by a client, employer, or colleague, rather than measured independently here. The source of each reported figure is named in its caveat.
Working
Observed duration of the hand migrations performed before the MCP existed.
Caveat
Patrick’s own practitioner estimate of typical effort from performing these migrations, not a timesheet total and not a client figure. Some portals ran under this and some over.
Who can confirm
Zuar engineering colleagues.
As of
2026-08-06
~1,480working hours of manual migration addressed

The size of the problem the tool was pointed at — roughly three quarters of a person-year of repetitive rewriting.

Estimated
How this was derived
What this basis means
Not instrumented. Derived from known task duration multiplied by observed volume. The arithmetic is shown so you can substitute your own assumptions.
Working
37 portals migrated through the MCP (40+ in scope, all but 3 completed with it) x ~40 working hours each = ~1,480 hours.
Caveat
This is the manual baseline the tool replaced, NOT net hours saved. Migrating through the MCP still costs real time, and that post-automation figure has not been measured. Net saving is therefore lower than this number and is deliberately not published.
Who can confirm
Zuar engineering colleagues.
As of
2026-08-06
Evidence
  • artifactThe manual process this replacednot public

    Rewriting every data-handling API call from one deprecated version to the next, portal by portal, while absorbing the other breaking changes that shipped alongside it — CSS among them. Each portal was its own hand migration.

    Employer intellectual property. The process is described here; the code is not public.

  • deployedMigration coveragenot public

    After the Portal MCP was built, every remaining production portal but three was migrated through it.

    Employer production estate.

Where it applied
  • A platform-wide API deprecation that would otherwise have consumed the implementation team for months of repeated, near-identical rewrites.
  • Breaking CSS changes absorbed in the same pass rather than as a second sweep across the estate.
What it implies

I look for the work that repeats and build the thing that absorbs it. The honest version of this claim is that I replaced roughly 1,480 hours of manual baseline — not that I saved all of it, because the post-automation cost has not been measured.

The two servers use genuinely different agent topologies, because the two problems have different shapes: a gated loop for authoring, a graph for cataloguing.

6specialist agents, 3 of them with no write tools

Each does one job and hands off through a JSON-Schema output contract, so the next stage builds on real state rather than a summary. The three that judge — code gate, visual gate, advisor — physically cannot mutate the portal.

Computed from source
How this was derived
What this basis means
Derived by counting the artifact itself — files, lines, checks, assets. Reproducible by anyone with repository access.
Working
Counted from the agent definitions in the repository, with the tool grant of each read from its own frontmatter.
As of
2026-08-06
2 + 2independently bounded fix rounds

Two gates, each capped separately: a code gate and a visual gate, both looping back to the debugger only for findings marked blocking. If either is still blocked at the cap, the pipeline surfaces the findings rather than shipping.

Computed from source
How this was derived
What this basis means
Derived by counting the artifact itself — files, lines, checks, assets. Reproducible by anyone with repository access.
Working
Read from the two loop conditions in the pipeline workflow source, each of the form round < 2.
Caveat
The visual gate is best-effort: if the browser tooling is unavailable it returns skipped rather than failing, so a missing extension can never block a ship.
As of
2026-08-06
2 of 6catalog pipeline nodes that call a model at all

Profiling, validation and persistence are deterministic by design — the documented reasoning is that checking one model’s output with another model just adds a second thing that can be wrong. Only description and classification get a model, and the expensive one goes only to the node a human will review.

Computed from source
How this was derived
What this basis means
Derived by counting the artifact itself — files, lines, checks, assets. Reproducible by anyone with repository access.
Working
Counted from the node definitions in the catalog server’s graph engine, each of which carries an explicit tier and a written reason for that tier.
As of
2026-08-06
Evidence
  • artifactPortal MCP — gated agent loopnot public

    Blocks are never shipped raw. A spec flows builder → stylist → responsive → debugger → adversary → advisor. The adversary is a read-only red team that must prove each finding with evidence; while it returns blocking findings the pipeline loops back to the debugger, bounded to two rounds. The adversary and advisor carry no write tools and physically cannot mutate the portal.

    Employer intellectual property.

  • artifactCatalog MCP — deterministic agent graphnot public

    A graph driver runs the catalog pipeline as a fixed process with no chat window in the loop, spawning the MCP server as its own client so every call passes the same guards, read-scope checks, and audit logging an interactive agent would. Model routing is explicit: a large model writes the prose a human reviews, a small one classifies against closed vocabularies.

    Employer intellectual property.

Where it applied
  • A block looks correct in a happy-path demo but blanks out on real data because a column constant drifted from its bound query alias — the adversary catches it before it ships.
  • An entire data estate is profiled, described, and classified into a reviewable semantic model by one command, with the expensive model used only where a human will actually read the output.
What it implies

I choose topology deliberately. A loop where the work needs adversarial iteration; a deterministic graph where it needs repeatability and auditability. Model routing follows the same logic — spend intelligence where a human will read the result.

I build permissions and row-level security into AI access from the start, because it is the thing that decides whether an AI rollout survives contact with a real organization.

Evidence
  • artifactPermission-lens architecturenot public

    The read-only chat server authenticates as one portal user, and the portal — not the model — enforces page and block group access and row-level security server-side. It warns when the supplied key looks administrative, because an admin key silently defeats both.

    Employer intellectual property.

  • artifactRow-level security transparencynot public

    Row-level security lives in datasource SQL as shortkeys. The server detects them and reports whether the data a user is looking at is actually filtered for them — so "is this per-user?" is an answerable question rather than an assumption.

    Employer intellectual property.

  • artifactGrounding rulesnot public

    Non-configurable rules ship with the server: answer only from tool results, quote values exactly, and say "I can't answer that" rather than guessing. Refusal is treated as a feature, not a failure.

    Employer intellectual property.

Where it applied
  • Two users ask the same assistant the same question about the same dashboard and correctly receive different answers, because row-level security applies to the AI exactly as it applies to the UI.
  • A finance page stays invisible to an assistant session belonging to a user without access to it — enforced server-side, not by prompt instruction.
What it implies

Getting a model to say "no" reliably is genuinely hard, and most teams underestimate it. Governance and row-level security are the parts of AI adoption people overlook and the parts that decide whether it scales past a demo.

4

MCP servers handed to the company

What I left behind at Zuar

Four years of work that outlives my own delivery: tooling that became company repositories, nine Claude skills that let colleagues build the way I build, and custom client work promoted into the product so it ships once instead of being rebuilt per engagement.

Source not publicAnalytics Implementation Manager · October 2022 — present3 metricssee the proof ▾

Offered as proof of: The difference between a strong individual contributor and someone who raises the ceiling for everyone around them. Most of what I built at Zuar is used by people who never worked on it with me.

  • TypeScript
  • Python
  • SQL
  • JavaScript
  • MCP
  • Claude Code
  • Zuar Portal
  • Zuar Runner

The tools I built stopped being mine. All four MCP servers now live in the company organisation as maintained repositories, not personal side projects.

4MCP servers handed to the company

Each has install instructions, a documented tool surface, and a security policy — the difference between a tool and something a team can adopt.

Computed from source
How this was derived
What this basis means
Derived by counting the artifact itself — files, lines, checks, assets. Reproducible by anyone with repository access.
Working
Counted from the four cust-* repositories referenced in the servers’ own installation documentation.
As of
2026-08-06
Evidence
  • repoFour servers under the company orgnot public

    zuar-portal-mcp, zuar-runner-mcp, zuar-portal-chat-mcp and zuar-catalog-mcp are mirrored to the zuarbase organisation as cust-* repositories, with releases, install paths for Claude Desktop and Claude Code, and their own documentation sets.

    Employer organisation, private repositories. Architecture and documentation structure described here.

  • docProductization documentationnot public

    The catalog server ships a productizing document setting out where it fits in the company product line — written so someone other than me could take it forward.

    Employer intellectual property.

Where it applied
  • A colleague installs the portal server from a release artifact and connects it to their own client portal without talking to me first.
  • A one-click bundle lets someone with no terminal experience run the server from Claude Desktop.
What it implies

I write things down and package them so they survive my attention moving elsewhere. Work that only functions while I am holding it is not a contribution to a company — it is a dependency on me.

I encoded how to build on our platform into skills the whole team can load, so the platform’s footguns stop being tribal knowledge.

9authored Claude skills

A new engineer gets version-aware knowledge of the API, data access, theming and migration on day one instead of learning it by breaking things.

Computed from source
How this was derived
What this basis means
Derived by counting the artifact itself — files, lines, checks, assets. Reproducible by anyone with repository access.
Working
Counted from the skills table in the repository README.
As of
2026-08-06
Evidence
  • repoNine Claude skills for the portal platformnot public

    Covering the core block API, block data access, database write-back, a v1.17→v1.18 migration guide, readable handoffs, making prototypes portal-ready, the brand theme, charting, and icon reference. Each is a skill directory with triggering frontmatter and supporting references.

    Mirrored from the employer organisation; not public.

  • artifactEstate documentationnot public

    Surveyed an undocumented estate across two instances and wrote the reference documentation the team now works from — business context, warehouse and lineage, ETL jobs, and a complete page-to-block map with per-page access restrictions.

    Client engagement under commercial confidentiality.

Where it applied
  • A colleague migrating blocks from v1.17 to v1.18 follows a written path instead of rediscovering the legacy data-access change.
  • A prototype built outside the platform is made portal-ready against a documented checklist rather than trial and error.
What it implies

The highest-leverage thing I did at Zuar was not any single portal. It was turning what I had learned the hard way into something loadable, so nobody else had to learn it the same way.

I pushed work up the stack: recurring custom client builds became product surface, and the same capability became reachable by an agent.

37production portals migrated through tooling I built

Work the implementation team would otherwise have absorbed by hand, portal by portal, at roughly forty working hours each.

Reported
How this was derived
What this basis means
Taken from professional record or supplied by a client, employer, or colleague, rather than measured independently here. The source of each reported figure is named in its caveat.
Working
40+ portals in scope, all but three completed through the MCP.
Caveat
Internal observation from inside the engineering team — not a client figure.
Who can confirm
Zuar engineering colleagues.
As of
2026-08-06
Evidence
  • artifactCustom blocks promoted into the product UInot public

    Use cases that previously required large amounts of inconsistent hand-written HTML per client were built into the interface, so the capability ships once rather than being rebuilt per engagement.

    Employer product work.

  • artifactMigration tooling applied to the production estatenot public

    The Portal MCP was pointed at a platform-wide API deprecation and carried all but three of the production portals through it.

    Employer production estate.

Where it applied
  • An advanced layout that used to mean a bespoke build per client became a configurable option anyone could deploy.
  • A deprecation that threatened months of repeated rewrites was absorbed by tooling instead of headcount.
What it implies

I notice when custom work has stopped being custom. Recognising a pattern and promoting it into product is the difference between a consultancy that scales and one that just bills more hours.

39,169

lines of GDScript across 136 files

At Will — a full ARPG, directed rather than hand-written

A single-player Diablo-2-like in Godot 4 with a playable five-act campaign, an LLM-driven in-game economy, an AI asset pipeline, and a self-built QA harness in the thousands of checks. Design-directed by me, implemented with Claude as engineer and QA.

Source not publicDesign director, architect, and QA owner · 20264 metricssee the proof ▾

Offered as proof of: The thing that is hardest to demonstrate on a resume: sustaining a large, coherent, quality-controlled software project over months by directing AI rather than typing every line — and shipping something that actually runs.

  • Godot 4.4
  • GDScript
  • Claude Code
  • PixelLab
  • Piper TTS

I directed a codebase of nearly 40,000 lines to a playable end-to-end campaign, and kept it verifiable the whole way.

39,169lines of GDScript across 136 files

Large enough that coherence stops being free and has to be engineered deliberately.

Computed from source
How this was derived
What this basis means
Derived by counting the artifact itself — files, lines, checks, assets. Reproducible by anyone with repository access.
Working
find . -name "*.gd" | wc -l for files; the same set piped through cat | wc -l for lines.
As of
2026-08-06
17,376art assets in the project tree

Produced through an AI asset pipeline with a render manifest and run log, not hand-drawn one at a time.

Computed from source
How this was derived
What this basis means
Derived by counting the artifact itself — files, lines, checks, assets. Reproducible by anyone with repository access.
Working
find assets -name "*.png" | wc -l.
As of
2026-08-06
29content-data files driving the game

Enemies, skills, affixes, uniques, sets, quests, factions, and economy events are data, not hard-coded — so balance is tunable without touching engine code.

Computed from source
How this was derived
What this basis means
Derived by counting the artifact itself — files, lines, checks, assets. Reproducible by anyone with repository access.
Working
Counted the JSON files and skill directory under data/.
As of
2026-08-06
112audio clips including per-NPC synthesized voice

Every voiced NPC has a distinct synthesized voice chain; humanoid enemies bark contextual lines in combat.

Computed from source
How this was derived
What this basis means
Derived by counting the artifact itself — files, lines, checks, assets. Reproducible by anyone with repository access.
Working
find assets -name "*.mp3" | wc -l.
As of
2026-08-06
Evidence
  • artifactGodot projectnot public

    Five acts with de-scaffolded quest chains, full enemy rosters, multi-phase act bosses, an open-world overworld, and an endgame progression ladder.

    Unreleased commercial game. Architecture, process, and metrics are described here; source is held back pending release.

  • artifactSmoketest harnessnot public

    A headless QA harness run as the definition of done. Every new mechanic extends it with checks; regressions from past bug audits are guarded by dedicated sections.

    Unreleased commercial game.

  • docDesign document setnot public

    World and story canon, class design, enemy mechanics, endgame, economy, and a time-economy pillar — each a standing source of truth that the implementation is held against.

    Unreleased commercial game.

Where it applied
  • A 13-sprint hardening push took acts two through five from scaffolding to real quest chains, full rosters, and scripted multi-phase bosses.
  • A full-surface QA audit produced 53 verified bug fixes including two priority-zero defects — a freeze and a quest softlock — each subsequently guarded by a regression check.
  • The isometric migration kept the square simulation grid as truth and treated the projection as a render concern, so the change did not touch game logic.
What it implies

I can hold a large system in my head, decide what "done" means, and build the harness that proves it. Directing AI at this scale is a discipline problem, not a prompting problem — and the discipline is what I brought.

I put an LLM inside the product, not just in the toolchain — as a narrator and tuner for the in-game economy, behind a defined contract.

Evidence
  • docEconomy design documentnot public

    Defines the Living Market: a theatrical economy of events with an explicit LLM narrator/tuner contract and guardrails on what the model is allowed to influence.

    Unreleased commercial game.

Where it applied
  • Market events are narrated dynamically at runtime rather than drawn from a fixed string table.
  • The model tunes economy parameters inside bounds the design document fixes, so it can add texture without breaking balance.
What it implies

I understand the difference between an LLM as a build-time assistant and an LLM as a runtime dependency — and that the second one needs a contract and guardrails.

21

Docker Compose stacks

FoxBrain — a self-hosted home lab with an AI front door

A live, still-evolving LAN-only home lab running 21 Docker stacks: a custom 14,583-line glass dashboard, its own config API, a dashboard-management MCP server, semantic retrieval over a 494-note knowledge base, and a Claude assistant that can propose any change and commit none of them without my approval.

Source not publicEverything · 20267 metricssee the proof ▾

Offered as proof of: Infrastructure literacy and a taste for interfaces: I run my own network services, and I build the front end I want rather than accepting the default one.

  • Docker Compose
  • Debian 12
  • Home Assistant
  • React
  • Vite
  • TypeScript
  • MCP
  • Claude API
  • Pi-hole

How it works

Any editDraftinstant previewnotouches automationUpdates liveStaged in queueReviewhuman gateApplyThe agent can propose every change and commit none of them.
Every change is staged; only device control executes

I organized the lab as independent arms, each with its own operating context, documentation, and specialist — so a change in one does not require understanding all of them.

21Docker Compose stacks

Media automation, LAN DNS, monitoring, home automation, a photo library, and a knowledge base, each independently deployable.

Computed from source
How this was derived
What this basis means
Derived by counting the artifact itself — files, lines, checks, assets. Reproducible by anyone with repository access.
Working
Directory count under the stacks tree, cross-checked against the figure stated in the lab overview document.
As of
2026-08-06
29uptime monitors across four groups

Includes two dead-man switches — the check that fires when the monitoring itself stops reporting, which is the failure mode monitoring usually misses.

Computed from source
How this was derived
What this basis means
Derived by counting the artifact itself — files, lines, checks, assets. Reproducible by anyone with repository access.
Working
Counted from the monitoring README: 27 service checks plus 2 push-based dead-man monitors.
As of
2026-08-06
0services intentionally exposed to the internet

A stated golden rule enforced by an explicit exposure policy, not an accident of configuration.

Computed from source
How this was derived
What this basis means
Derived by counting the artifact itself — files, lines, checks, assets. Reproducible by anyone with repository access.
Working
Stated as the lab’s governing rule in the README and enforced by the security arm’s exposure policy.
As of
2026-08-06
Evidence
  • repofoxbrain-homelabnot public

    The repository is the lab. It lives on the NAS itself as the single source of truth, with documented cross-arm handoffs for tasks that span boundaries.

    Contains network topology and host detail for a live private network.

  • repofoxbrain-glassnot public

    The dashboard stack extracted as a standalone repository: React UI with a 3D fox and glass panels, a config API, an MCP server for managing the dashboard, and a Claude-powered chat assistant with its own Home Assistant integration.

    Extracted from the private home-lab monorepo.

Where it applied
  • The in-dashboard assistant stages dashboard and Home Assistant edits for human review rather than applying them directly.
  • An MCP server exposes dashboard configuration so changes can be made conversationally and still land in version control.
What it implies

The architecture instinct I apply at work is the same one I apply when nobody is grading it. The chatbot on this site is the same pattern, pointed at my own record.

I built a working RAG assistant over my own knowledge base — the same pattern as the assistant on this site, on infrastructure I run myself.

Evidence
  • artifactObsidian-backed retrievalnot public

    A personal knowledge base in an Obsidian vault, exposed through a knowledge-base API and retrieved over by the in-house assistant, so answers are grounded in my own notes rather than model recall.

    Contains personal notes and live network detail.

  • artifactRules and guardrailsnot public

    The assistant runs under working behavioural rules and guardrails, and stages dashboard and home-automation edits for review instead of applying them directly.

    Extracted from the private home-lab monorepo.

Where it applied
  • Asking the house a question and getting an answer grounded in my own documentation rather than a plausible guess.
  • An assistant that proposes a change to the dashboard and waits for approval rather than acting on it.
What it implies

Retrieval, grounding, and a human approval step are not theory for me. I run them at home, on hardware I maintain, and it is still in active development rather than a finished demo.

I gave the house assistant real tools and then made it structurally unable to misuse them: device control executes, everything else is staged for my review.

18dashboard tools, of which 15 reach the agent

The three lifecycle tools — apply, discard, review — are deliberately withheld. The agent can propose every change and commit none of them.

Computed from source
How this was derived
What this basis means
Derived by counting the artifact itself — files, lines, checks, assets. Reproducible by anyone with repository access.
Working
Counted from the tool list in the dashboard MCP server README, cross-checked against the set wired into the chat backend.
As of
2026-08-06
14,583lines across the dashboard UI

Eighty-two TypeScript and TSX files, nineteen zone sections, thirty-three components — a real front end rather than a themed template.

Computed from source
How this was derived
What this basis means
Derived by counting the artifact itself — files, lines, checks, assets. Reproducible by anyone with repository access.
Working
wc -l across src for .ts, .tsx and .css; file counts from find and ls over src/sections and src/ui.
As of
2026-08-06
494notes in the retrieved knowledge base

The corpus the semantic search actually answers from — large enough that keyword matching stops being sufficient.

Computed from source
How this was derived
What this basis means
Derived by counting the artifact itself — files, lines, checks, assets. Reproducible by anyone with repository access.
Working
find over the vault for markdown files, piped to wc -l.
As of
2026-08-06
Evidence
  • artifactTwo-lane execution modelnot public

    Exactly one tool acts immediately — device control. Every dashboard edit and every persistent configuration change is written to a draft queue instead, and nothing executes until I open Review and apply it in the browser.

    Runs on a live private network; architecture described, source withheld.

  • artifactGuardrails by tool surface, not by promptnot public

    The mutating tools and the apply/discard lifecycle tools are simply never given to the model. It cannot call what it cannot see. Prompt instructions exist too, but they are the second line, not the first.

    Runs on a live private network.

  • artifactKey never reaches the browsernot public

    The tool-use loop runs server-side on the NAS, which also lets it act as a client to services that are bound to localhost and unreachable from any hosted connector.

    Runs on a live private network.

Where it applied
  • Asking the assistant to rearrange a dashboard: it stages the change, the edit bar shows pending work, and nothing moves until I approve it.
  • Asking a question that sounds like a command — "is the garage light on?" — and getting an answer rather than an actuation.
What it implies

This is the same principle as the portal work, applied where I am the only person who suffers if it is wrong. An agent that can propose everything and commit nothing is far more useful than one you are afraid to give tools to.

I built the retrieval layer myself rather than reaching for a vector database, because at this corpus size the database is the complexity, not the solution.

1,500chunk ceiling the brute-force search runs against

Below this, a linear scan is genuinely fast and has no index to corrupt, no service to run, and no migration to perform. Above it, the calculus changes — and the ceiling is explicit so it is obvious when it has been crossed.

Computed from source
How this was derived
What this basis means
Derived by counting the artifact itself — files, lines, checks, assets. Reproducible by anyone with repository access.
Working
Read from the MAX_CHUNKS constant in the retrieval module, alongside a 400-word chunk size.
As of
2026-08-06
Evidence
  • artifactLocal embeddings, brute-force searchnot public

    Embeddings come from a local model served on the lab; the index is a single JSON file written atomically; similarity is cosine, hand-rolled in the standard library. No numpy, no vector database, no approximate-nearest-neighbour index.

    Runs on a live private network.

  • artifactTwo search modes, deliberately differentnot public

    A keyword lookup for "what is this device and where does it live", and semantic search for meaning. The tool descriptions tell the model which to reach for first, so it does not use the expensive one for a lookup.

    Runs on a live private network.

Where it applied
  • Answering a question from my own notes rather than from model recall, with the source note named.
  • A scheduled reindex that only runs when the index is actually stale, so a restart does not trigger a full re-embed.
What it implies

Knowing when not to add infrastructure is a skill. A JSON file and a cosine loop is the right answer for 494 notes, and I wrote down the threshold where it stops being right.

24+

portals built

Portal blocks and embedded analytics delivery

Custom HTML, JavaScript, and SQL blocks delivered inside client analytics portals, plus the version-control and builder tooling around them.

Client-confidentialAnalytics Implementation Manager · October 2022 — present7 metricssee the proof ▾

Offered as proof of: Turning an abstract business request into an interface a non-technical audience actually uses — the delivery half of analytics work, where most implementations fail.

  • JavaScript
  • HTML
  • CSS
  • SQL
  • Tableau
  • ThoughtSpot
  • Power BI

I delivered analytics portals end to end — strategy, architecture, build, and adoption — for audiences up to Fortune 500 scale.

1 item you can open and check yourself

24+portals built

Enough repetition to have seen the same implementation failure modes more than once — and to know which ones are the platform rather than the client.

Reported
How this was derived
What this basis means
Taken from professional record or supplied by a client, employer, or colleague, rather than measured independently here. The source of each reported figure is named in its caveat.
Working
Count of portals personally built over October 2022 to present. Distinct from the 40+ figure elsewhere on this page, which is the size of the production estate carried through the API migration and includes portals built by others.
Caveat
Self-reported from professional record. An earlier resume cites 12+, which was the count at the time it was written.
As of
2026-08-06
200+portal pages, charts and dashboards built

The unit clients actually use. A portal is a container; pages are where the work lands and where adoption is won or lost.

Reported
How this was derived
What this basis means
Taken from professional record or supplied by a client, employer, or colleague, rather than measured independently here. The source of each reported figure is named in its caveat.
Working
Aggregate across the portals above, counted from delivery records.
Caveat
Self-reported from professional record.
As of
2026-08-06
2,000+consulting hours delivered

Direct client-facing implementation time.

Reported
How this was derived
What this basis means
Taken from professional record or supplied by a client, employer, or colleague, rather than measured independently here. The source of each reported figure is named in its caveat.
Working
Recorded in professional history.
As of
2026-08-06
40%higher adoption rate

Adoption is the metric that decides whether an analytics build was worth commissioning.

Reported
How this was derived
What this basis means
Taken from professional record or supplied by a client, employer, or colleague, rather than measured independently here. The source of each reported figure is named in its caveat.
Caveat
Client-reported. The measurement method is the client’s and is not independently verified here.
As of
2026-08-06
85%user retention

Sustained use after launch, rather than a launch-week spike.

Reported
How this was derived
What this basis means
Taken from professional record or supplied by a client, employer, or colleague, rather than measured independently here. The source of each reported figure is named in its caveat.
Caveat
Client-reported, on the client’s own definition of an active user.
As of
2026-08-06
Evidence
  • deployedPortal launchesnot public

    Twelve or more portals launched, spanning greenfield data strategy, source-system modeling, ELT automation, BI deployment, and secure single sign-on.

    Client engagements under commercial confidentiality. Clients are described by sector rather than named.

  • Public tooling for authoring portal blocks.

Where it applied
  • A workforce-automation vendor serving enterprise contact centres: portal architecture supporting day-to-day operational decisions across a large agent population.
  • A global food service and facilities group: operational reporting surfaced to site-level managers who are not analysts.
  • A national healthcare architecture practice: portal delivery against an existing BI estate.
What it implies

I have shipped this pattern enough times to know that the build is the easy half. Adoption is the deliverable.

I turned recurring one-off custom work into product surface, so features that used to need bespoke HTML became something anyone could deploy.

1 item you can open and check yourself

5portal blocks authored

Written once, then generalized into product rather than left as per-client bespoke code.

Reported
How this was derived
What this basis means
Taken from professional record or supplied by a client, employer, or colleague, rather than measured independently here. The source of each reported figure is named in its caveat.
Working
Direct count of blocks authored.
As of
2026-08-06
Evidence
  • artifactCustom blocks promoted into the UInot public

    Use cases that previously required large amounts of inconsistent hand-written HTML per client were built into the product interface, so the capability ships once instead of being rebuilt per engagement.

    Employer product work.

  • artifactSame features reachable by agentnot public

    The Portal MCP can author the same advanced blocks, so the capability is available through the UI to a human and through tools to an agent.

    Employer intellectual property.

  • Public authoring tooling for portal blocks.

Where it applied
  • An advanced layout that previously meant a custom HTML build per client became a configurable option in the interface.
  • The same capability became reachable conversationally through the MCP, so an implementation engineer can describe it instead of hand-writing it.
What it implies

The instinct that matters here is noticing when custom work has stopped being custom. Recognising a pattern and promoting it into product is what separates delivery from consulting churn.

I helped a company get AI-ready by building the layer AI actually needs: an accurate, governed semantic model of their data. This is the governance side of the contact-centre engagement described elsewhere on this page, not a separate client.

6linked registries in the spine

Source, Field, Model, Measure, KPI and Use — each with its own key, so the chain from raw system to executive KPI is navigable in both directions.

Computed from source
How this was derived
What this basis means
Derived by counting the artifact itself — files, lines, checks, assets. Reproducible by anyone with repository access.
Working
Counted from the registry workbook produced by the extract.
Caveat
This is the same engagement described in the contact-centre case study, viewed from the governance side rather than the delivery side. The extract volumes — dictionary, lineage and term counts — are reported there once, not repeated here.
As of
2026-08-06
Evidence
  • artifactAI centre of excellencenot public

    Established the practice and the operating model for how AI work would be evaluated, governed, and adopted internally.

    Client engagement under commercial confidentiality.

  • artifactSix linked registriesnot public

    A spine of Source → Field → Model → Measure → KPI → Use, each registry keyed and linked to the next, so any number on a dashboard can be walked back to the field and the system it came from.

    Client engagement under commercial confidentiality.

  • artifactExtract → Ratify → Store → Regeneratenot public

    A repeatable loop rather than a documentation exercise: extraction is automated from the warehouse, ratification is owned by named business owners, the canonical result is stored, and regeneration exposes only certified definitions to AI tooling.

    Client engagement under commercial confidentiality.

  • docGovernance auditnot public

    A per-datasource audit covering connection, schema, tables, query type and calculations, surfacing duplicates, frozen datasources and abandoned proofs-of-concept with a remediation order.

    Client engagement under commercial confidentiality.

Where it applied
  • Replacing the recurring cycle of meetings held purely to confirm what a field means with a dictionary that answers it.
  • Exposing only ratified, certified definitions to AI tooling, so an assistant answers from an owned definition rather than inferring meaning from a column name.
  • Making blast radius knowable before a change: a duplicated or frozen datasource is visible in the audit rather than discovered when a page breaks.
What it implies

"AI ready" is not a model selection problem. It is a data definition and governance problem. The load-bearing design decision is that regeneration exposes only certified definitions to AI — an assistant pointed at an ungoverned warehouse will answer confidently from whatever it finds, and the semantic layer is what makes "I don't know" possible. The deterministic, reusable process is worth more than the document it produces.

23

reusable dashboard components in the catalogue

Food-service client reporting at account scale

Delivered for a contract food-service and facilities operator running client-facing analytics for corporate, higher-education and healthcare accounts.

Client-confidentialAnalytics Implementation Manager · 2025-20269 metrics · 4 screenshotssee the proof ▾

Offered as proof of: Client-facing analytics delivery: turning an operational question into an interface non-analysts use daily.

  • Zuar Portal
  • Tableau
  • Power BI
  • Snowflake
  • SQL
  • JavaScript
  • ECharts

Interface

Real interface, synthetic data — every value replaced before capture

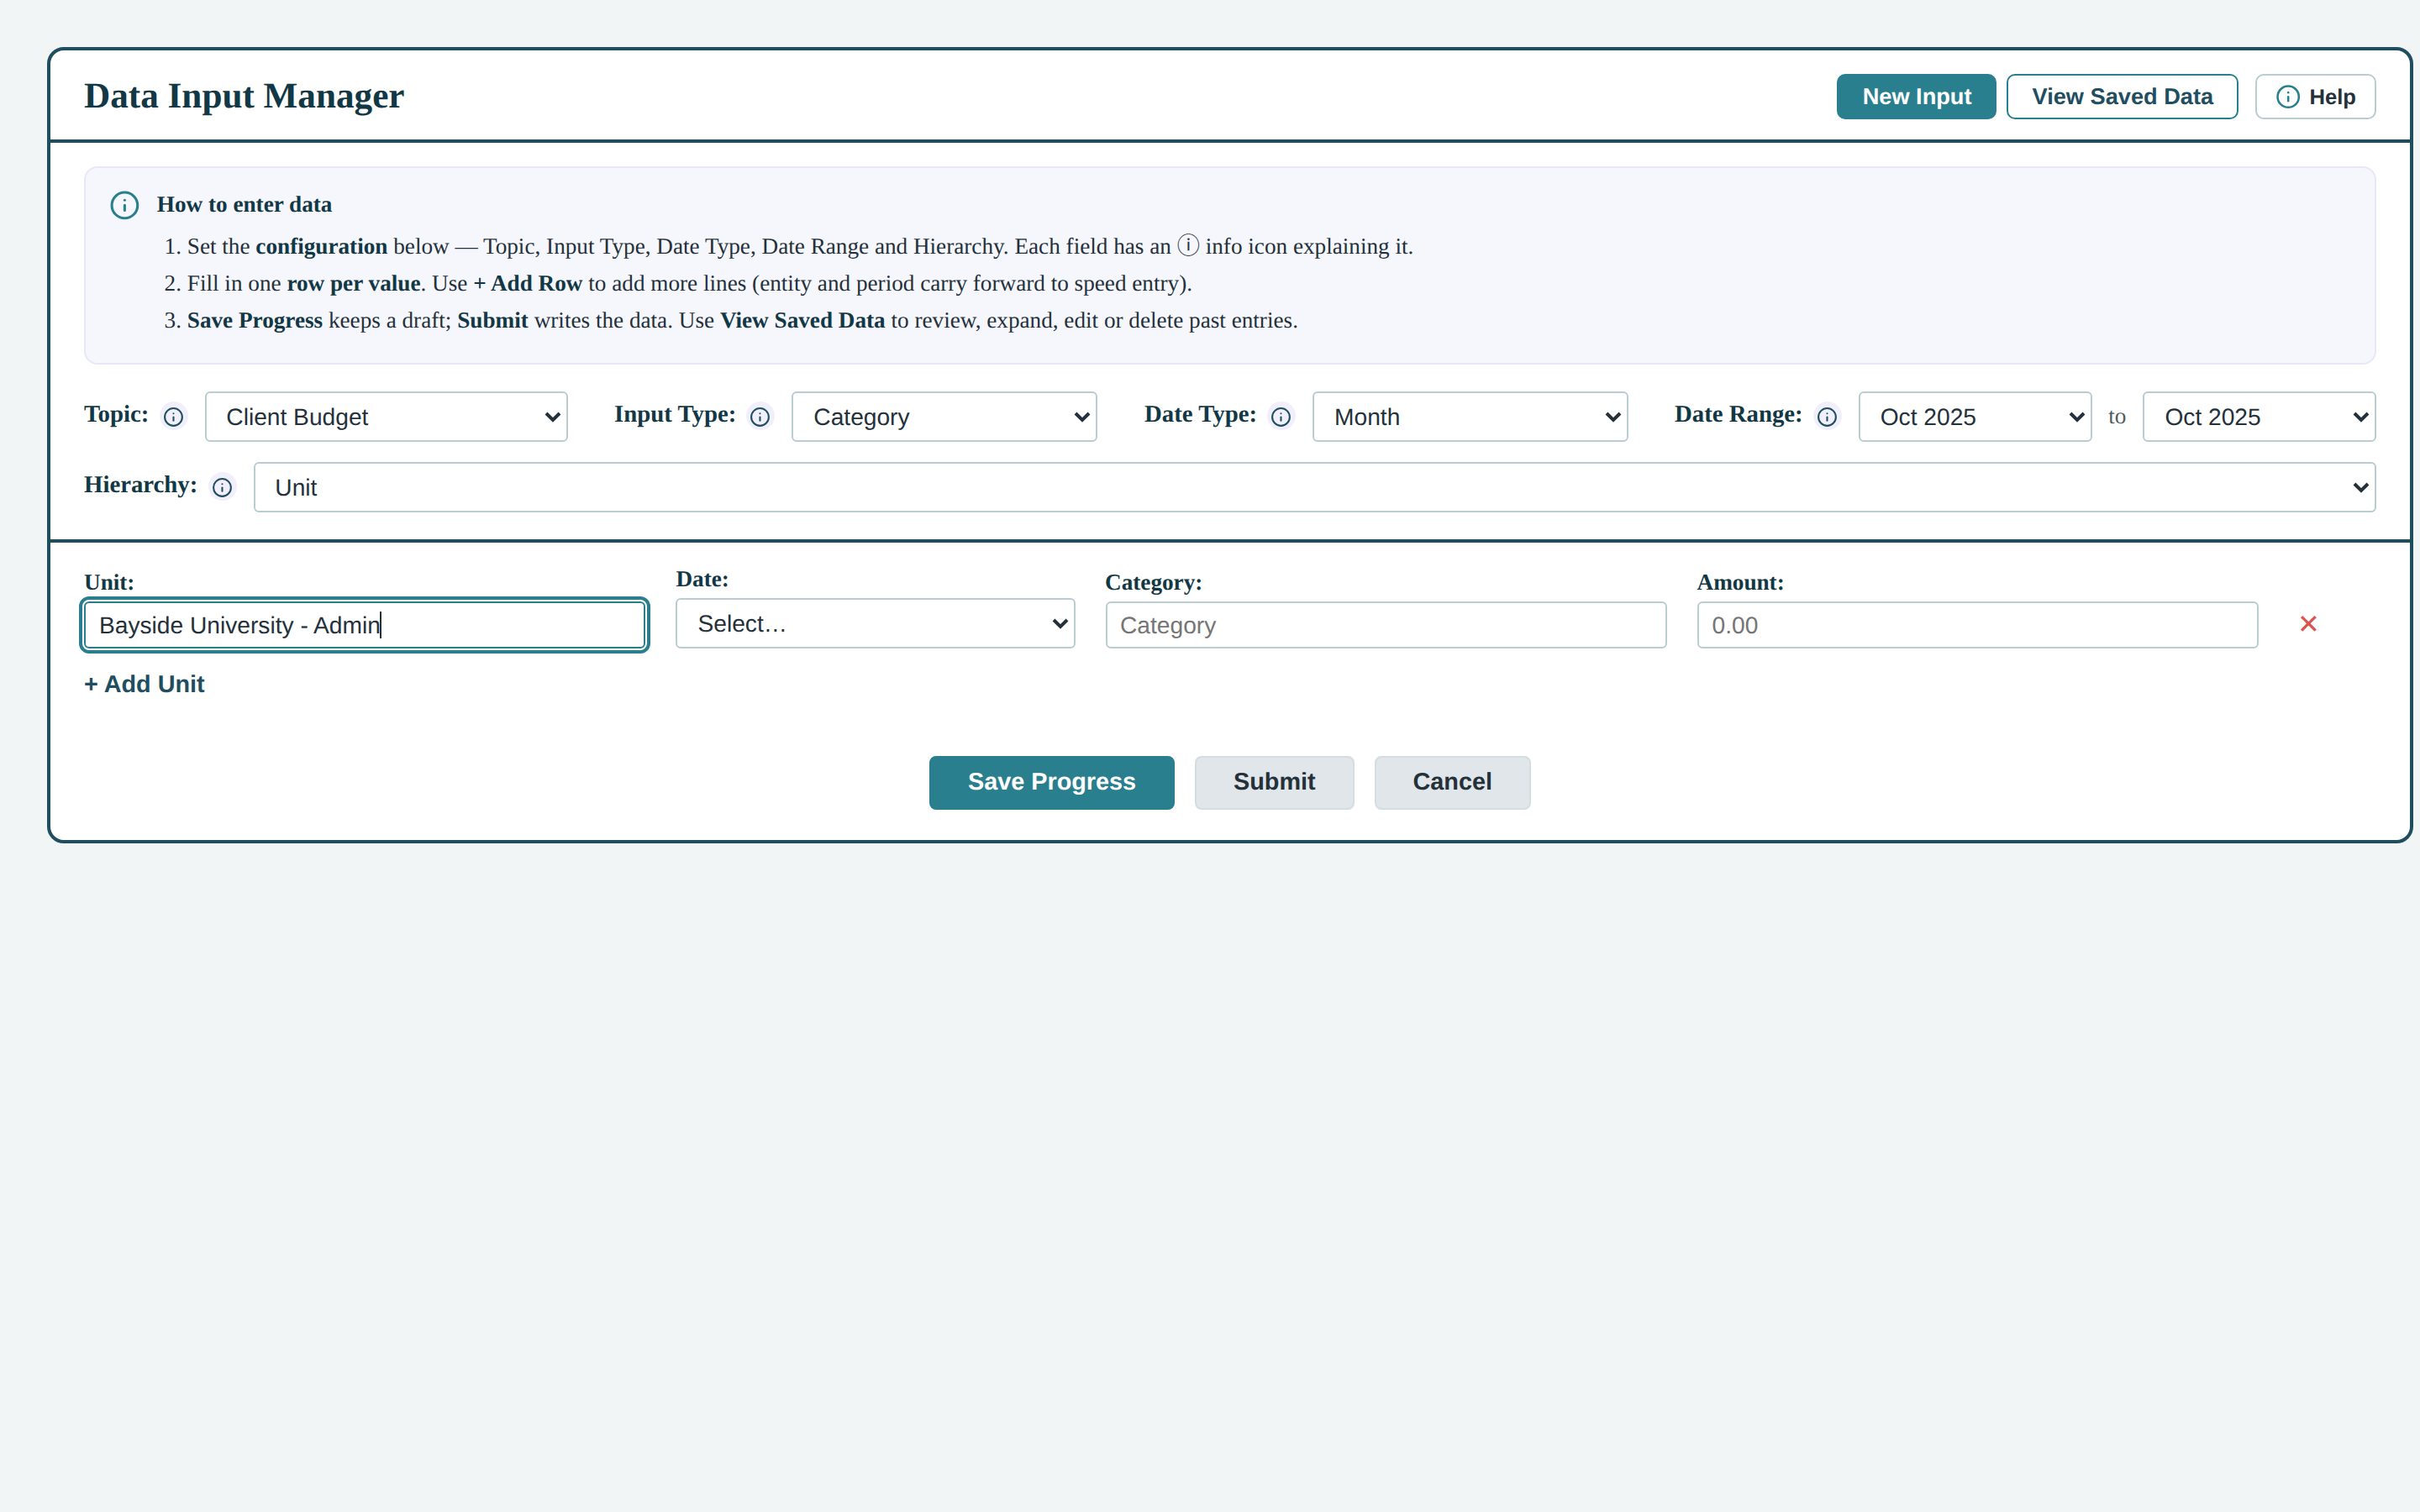
The warehouse write-back form, configured: topic, input type, date grain, date range and hierarchy level chosen, with a generated entry row and an entity selected through the typeahead.

The warehouse write-back form, configured: topic, input type, date grain, date range and hierarchy level chosen, with a generated entry row and an entity selected through the typeahead.

What was anonymized

Heaviest redaction of the set. The block's built-in reference data — real university client names, internal client/complex/unit identifier codes, and real GL account numbers — was replaced wholesale with same-shape synthetic entities (five fictional institutions, matching key formats). Purple brand palette remapped to the same neutral petrol scheme. HTML comments stripped, removing the warehouse database, schema and table names. An automated deny-list gate (client names, brand hex, employee email domains, warehouse terms) ran against the composed document and had to pass before rendering. The amount field was deliberately left at its placeholder rather than filled with a fabricated figure.

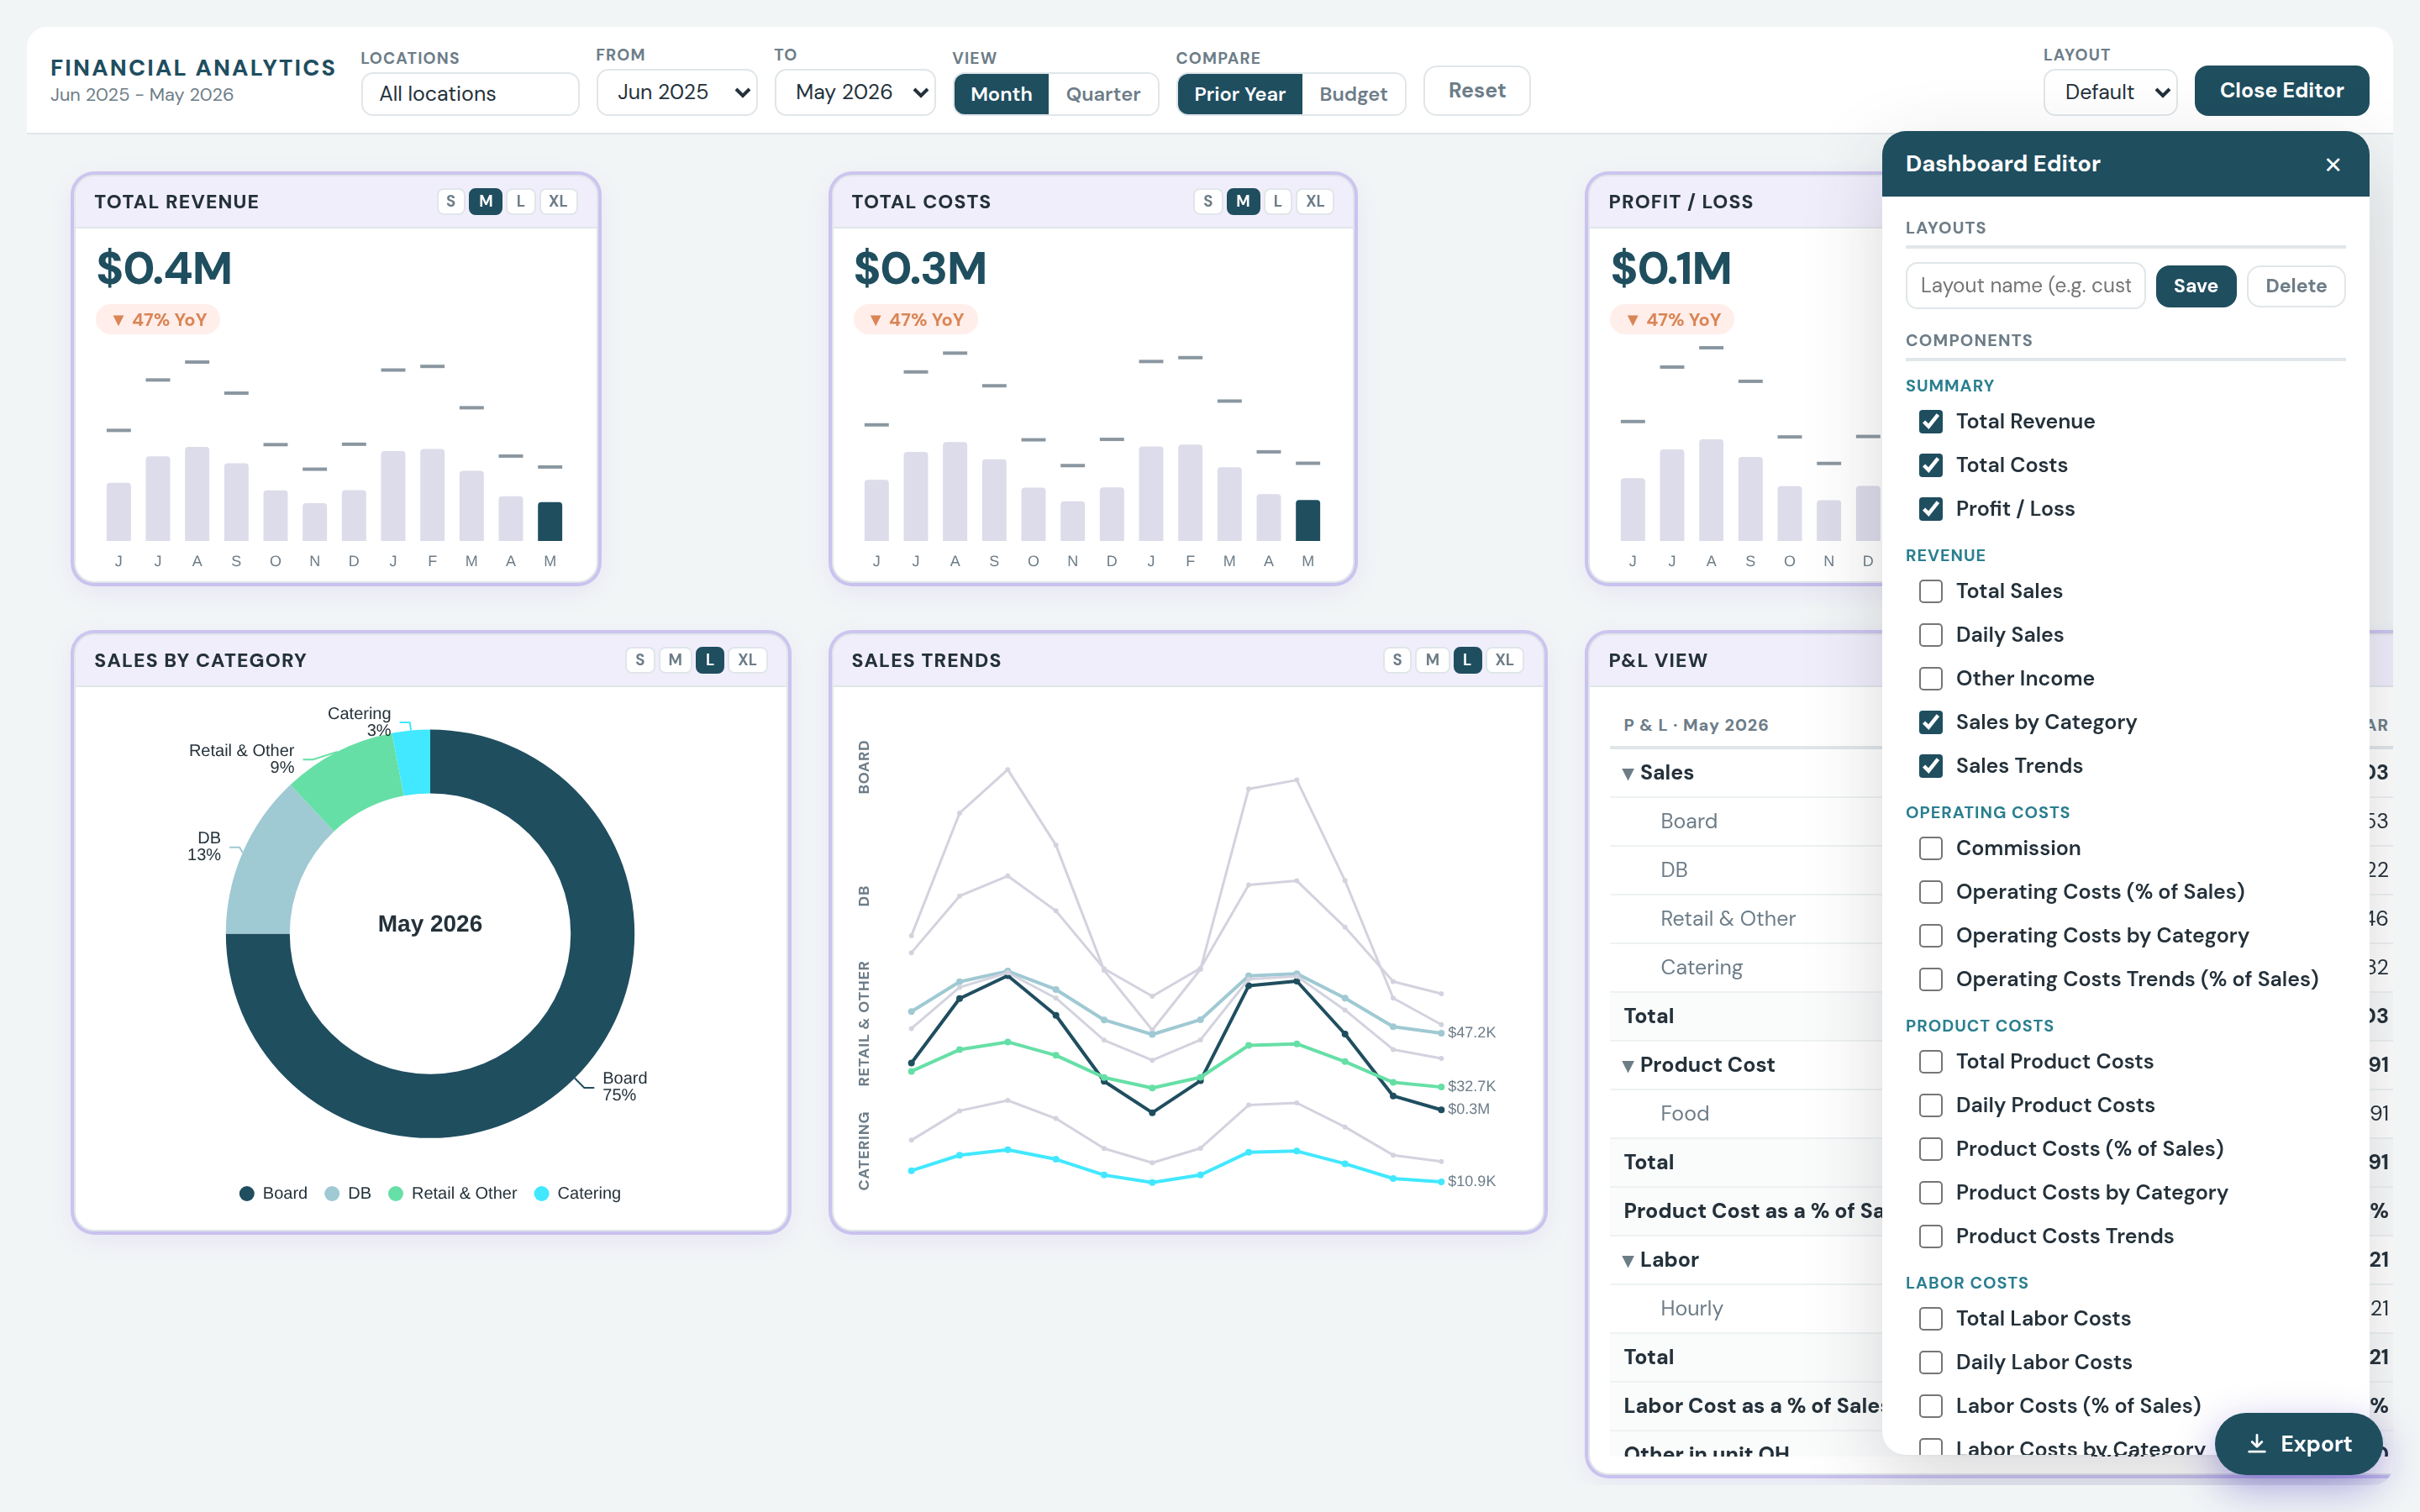
The dashboard editor open over the canvas: component catalogue grouped by category with checkbox selection, per-tile S/M/L/XL size selectors, and named layout save/delete. This is the construct the build rests on — tile size selects one of four progressive views of the same data point.

The dashboard editor open over the canvas: component catalogue grouped by category with checkbox selection, per-tile S/M/L/XL size selectors, and named layout save/delete. This is the construct the build rests on — tile size selects one of four progressive views of the same data point.

What was anonymized

As above. Additionally, the editor was opened by a scripted click on the local render; no live interaction occurred.

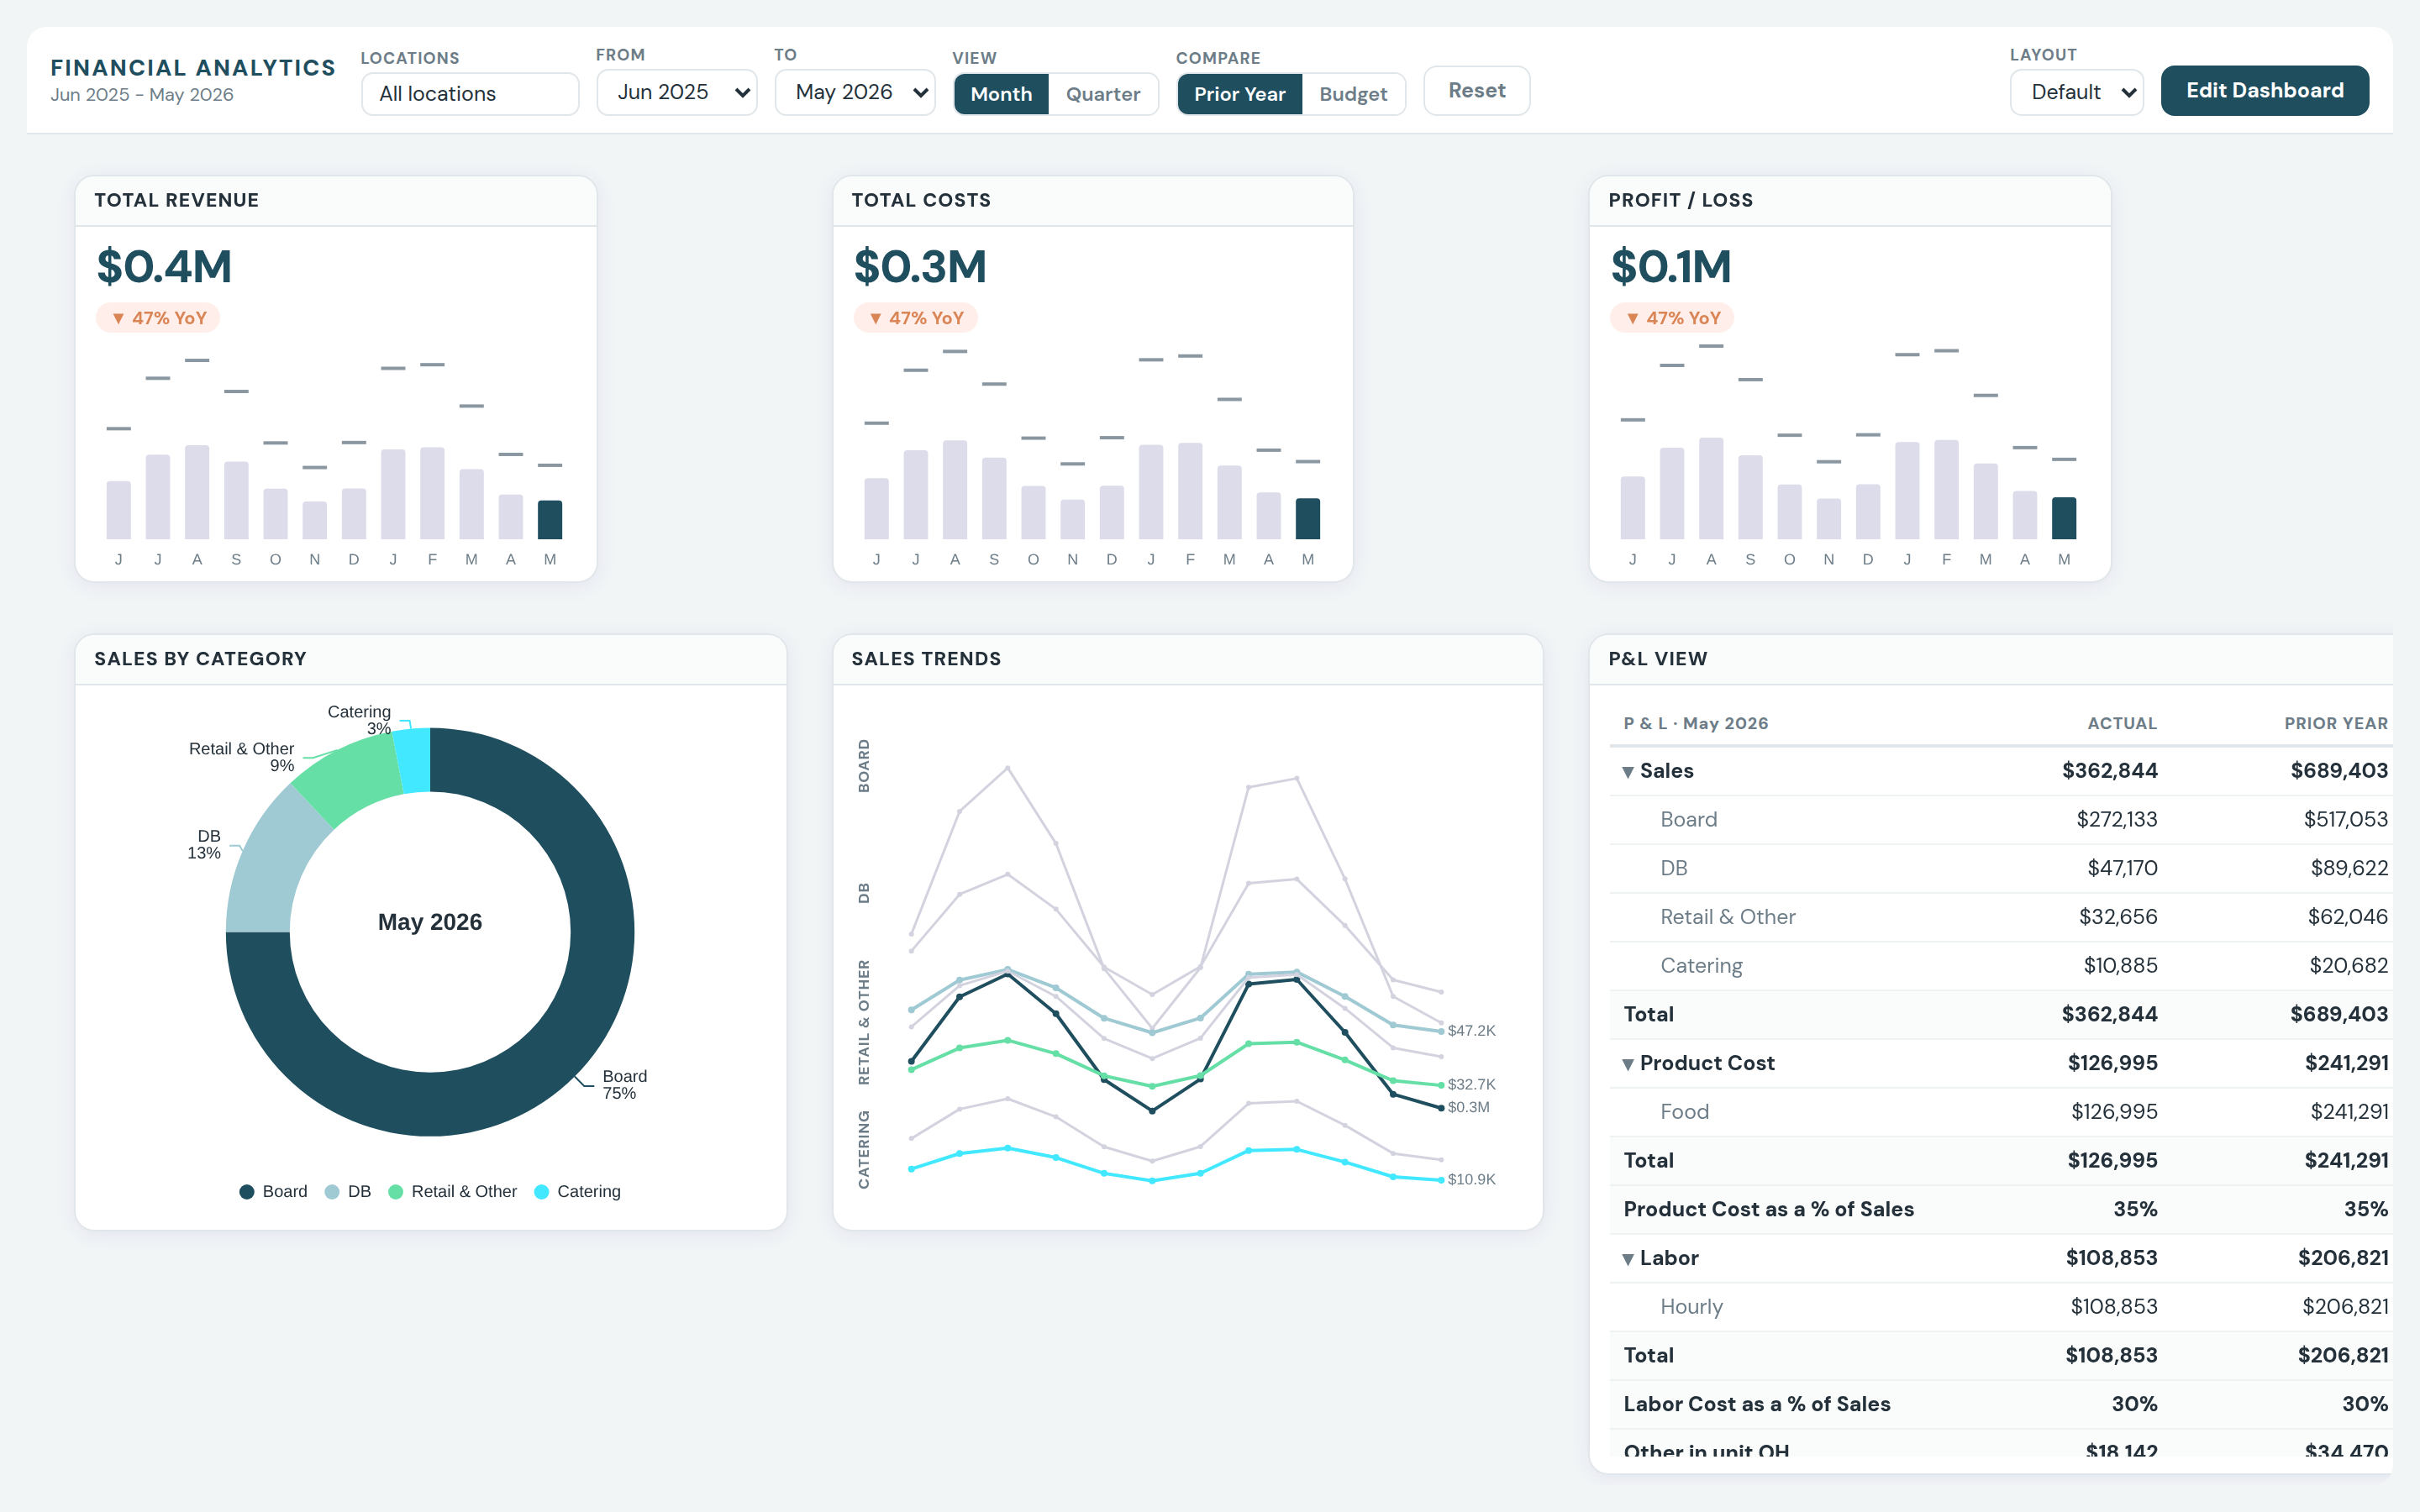
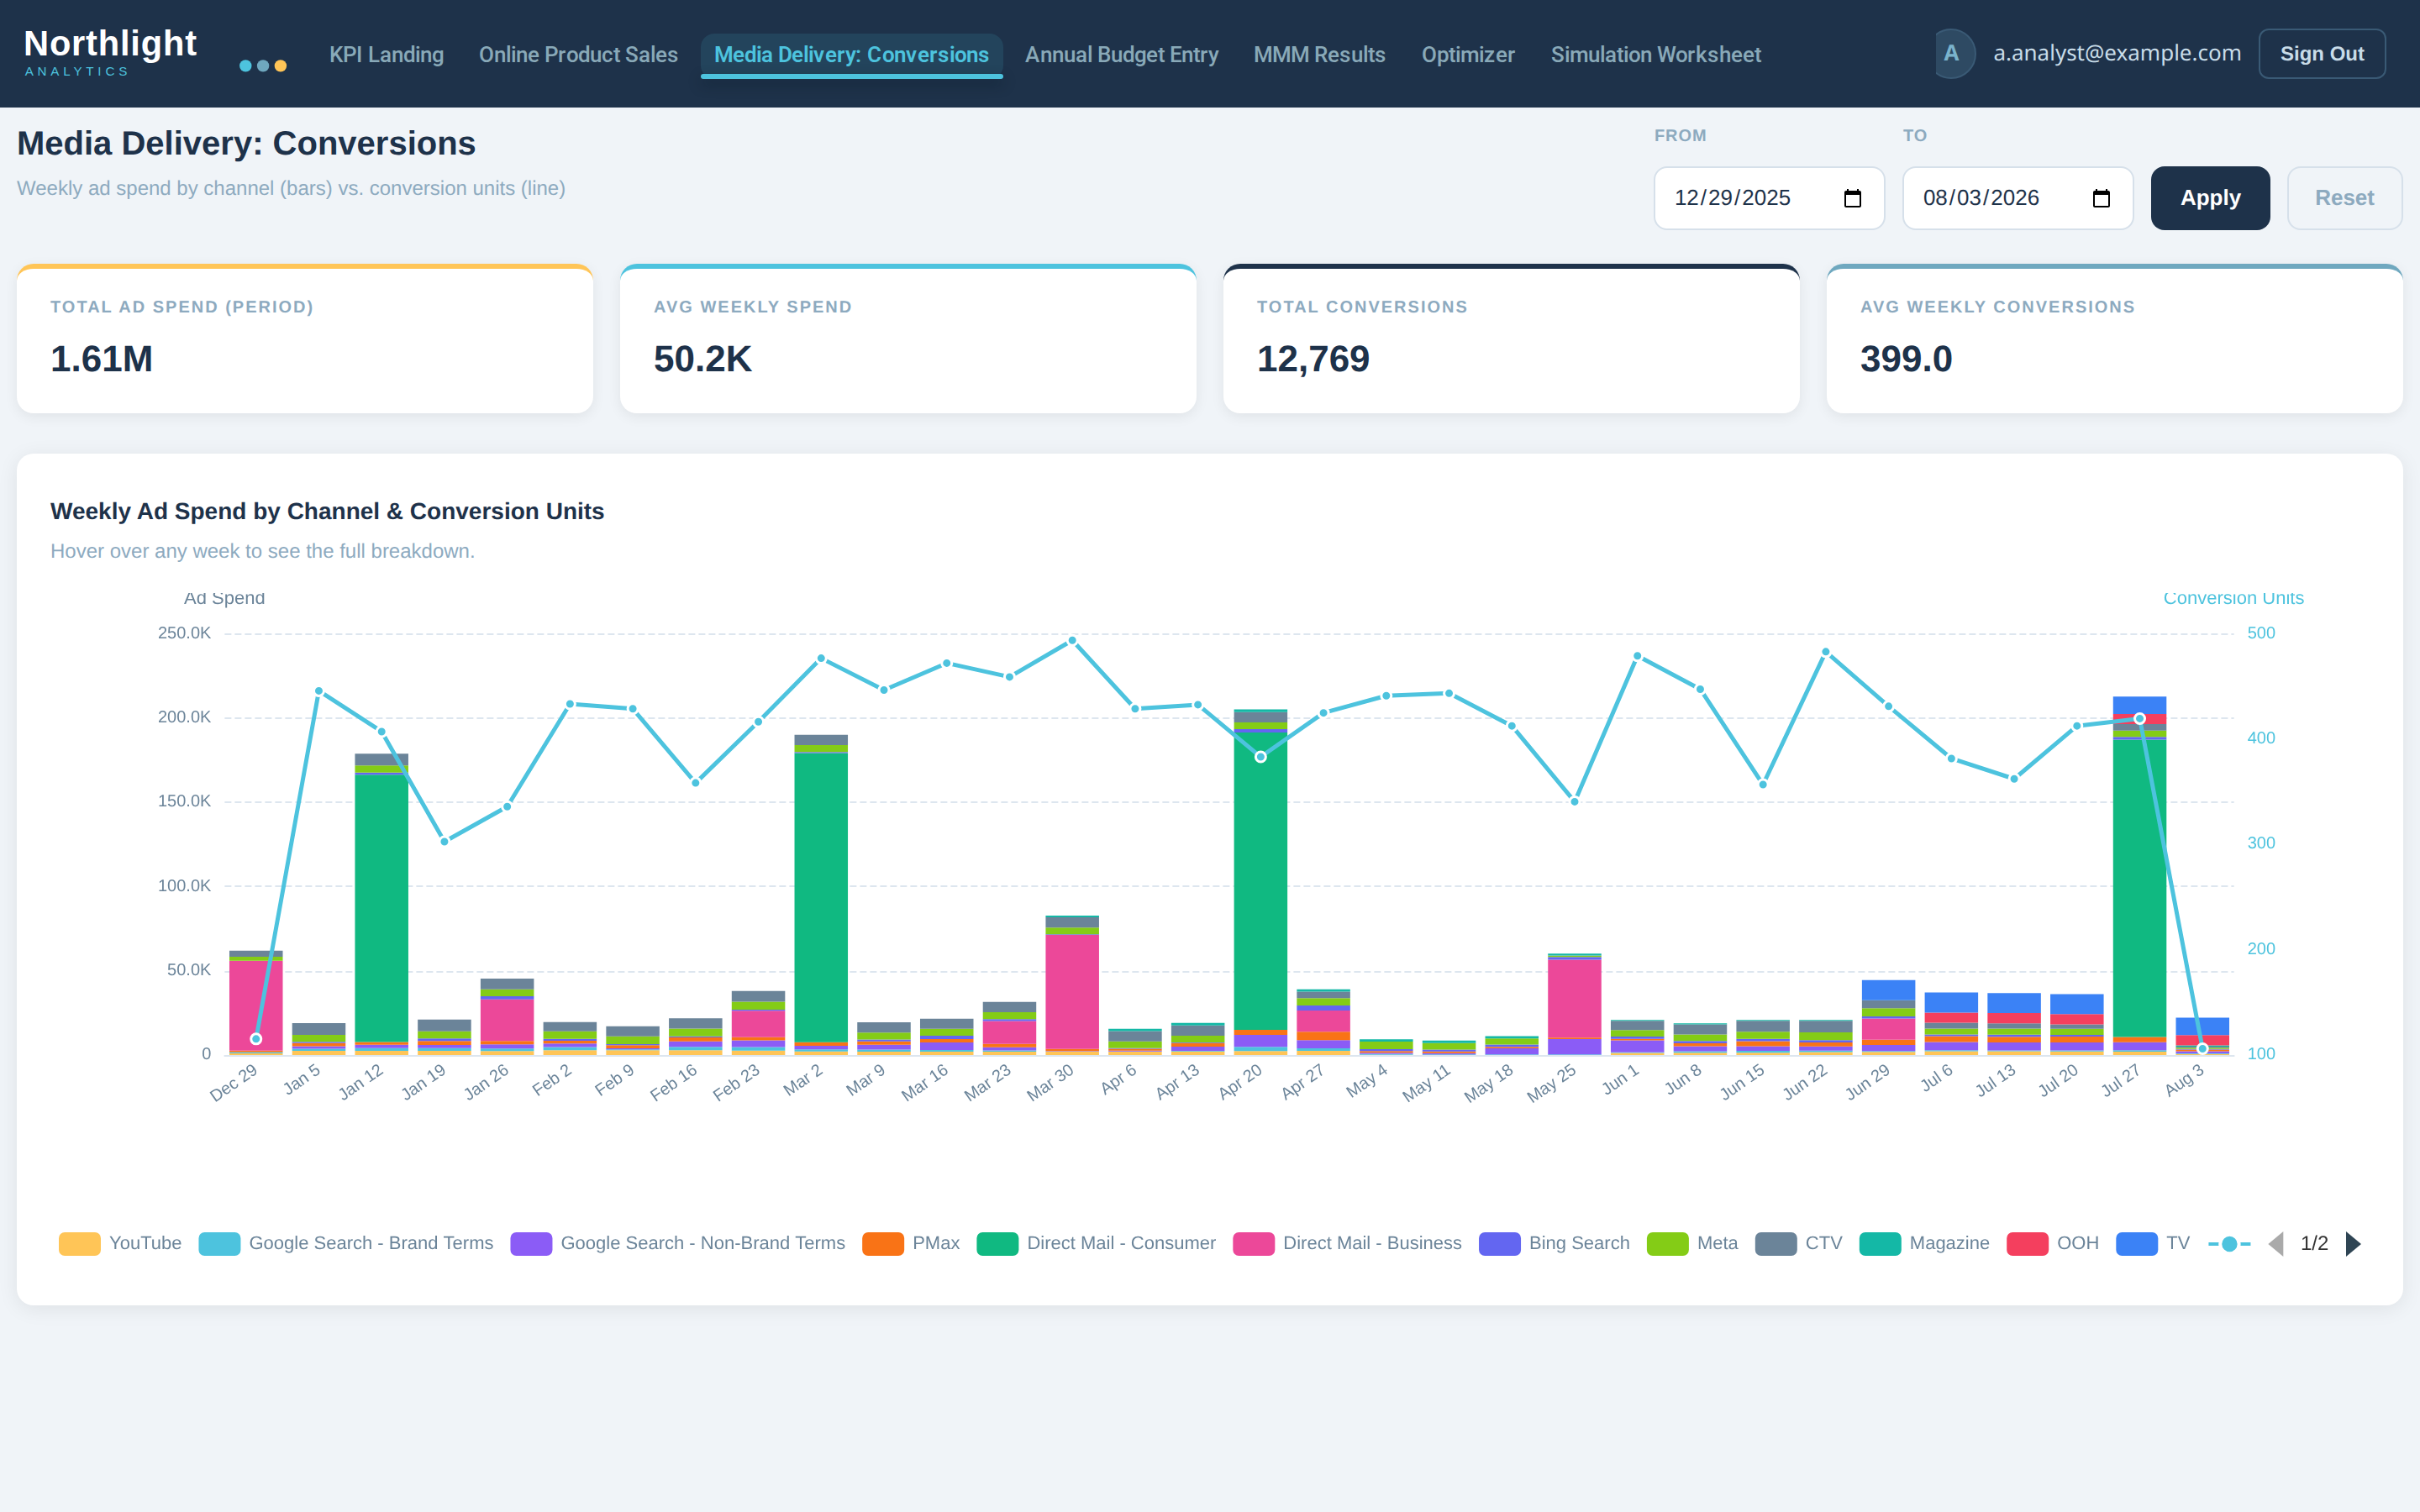
The modular reporting dashboard: KPI tiles with comparison sparklines, category donut, small-multiple trend panel, expandable P&L table, and the filter bar (locations, date range, month/quarter, prior-year/budget).

The modular reporting dashboard: KPI tiles with comparison sparklines, category donut, small-multiple trend panel, expandable P&L table, and the filter bar (locations, date range, month/quarter, prior-year/budget).

What was anonymized

Rendered with no portal global present, so the block falls back to its built-in synthetic dataset (fictional units, `client: 'Demo'`, deterministic values). HTML comments stripped, removing the tenant hostname and data source identifiers. Client brand indigo remapped across both the CSS token set and the JS chart palette to a neutral petrol scheme. No logo, wordmark, username, URL or real figure present.

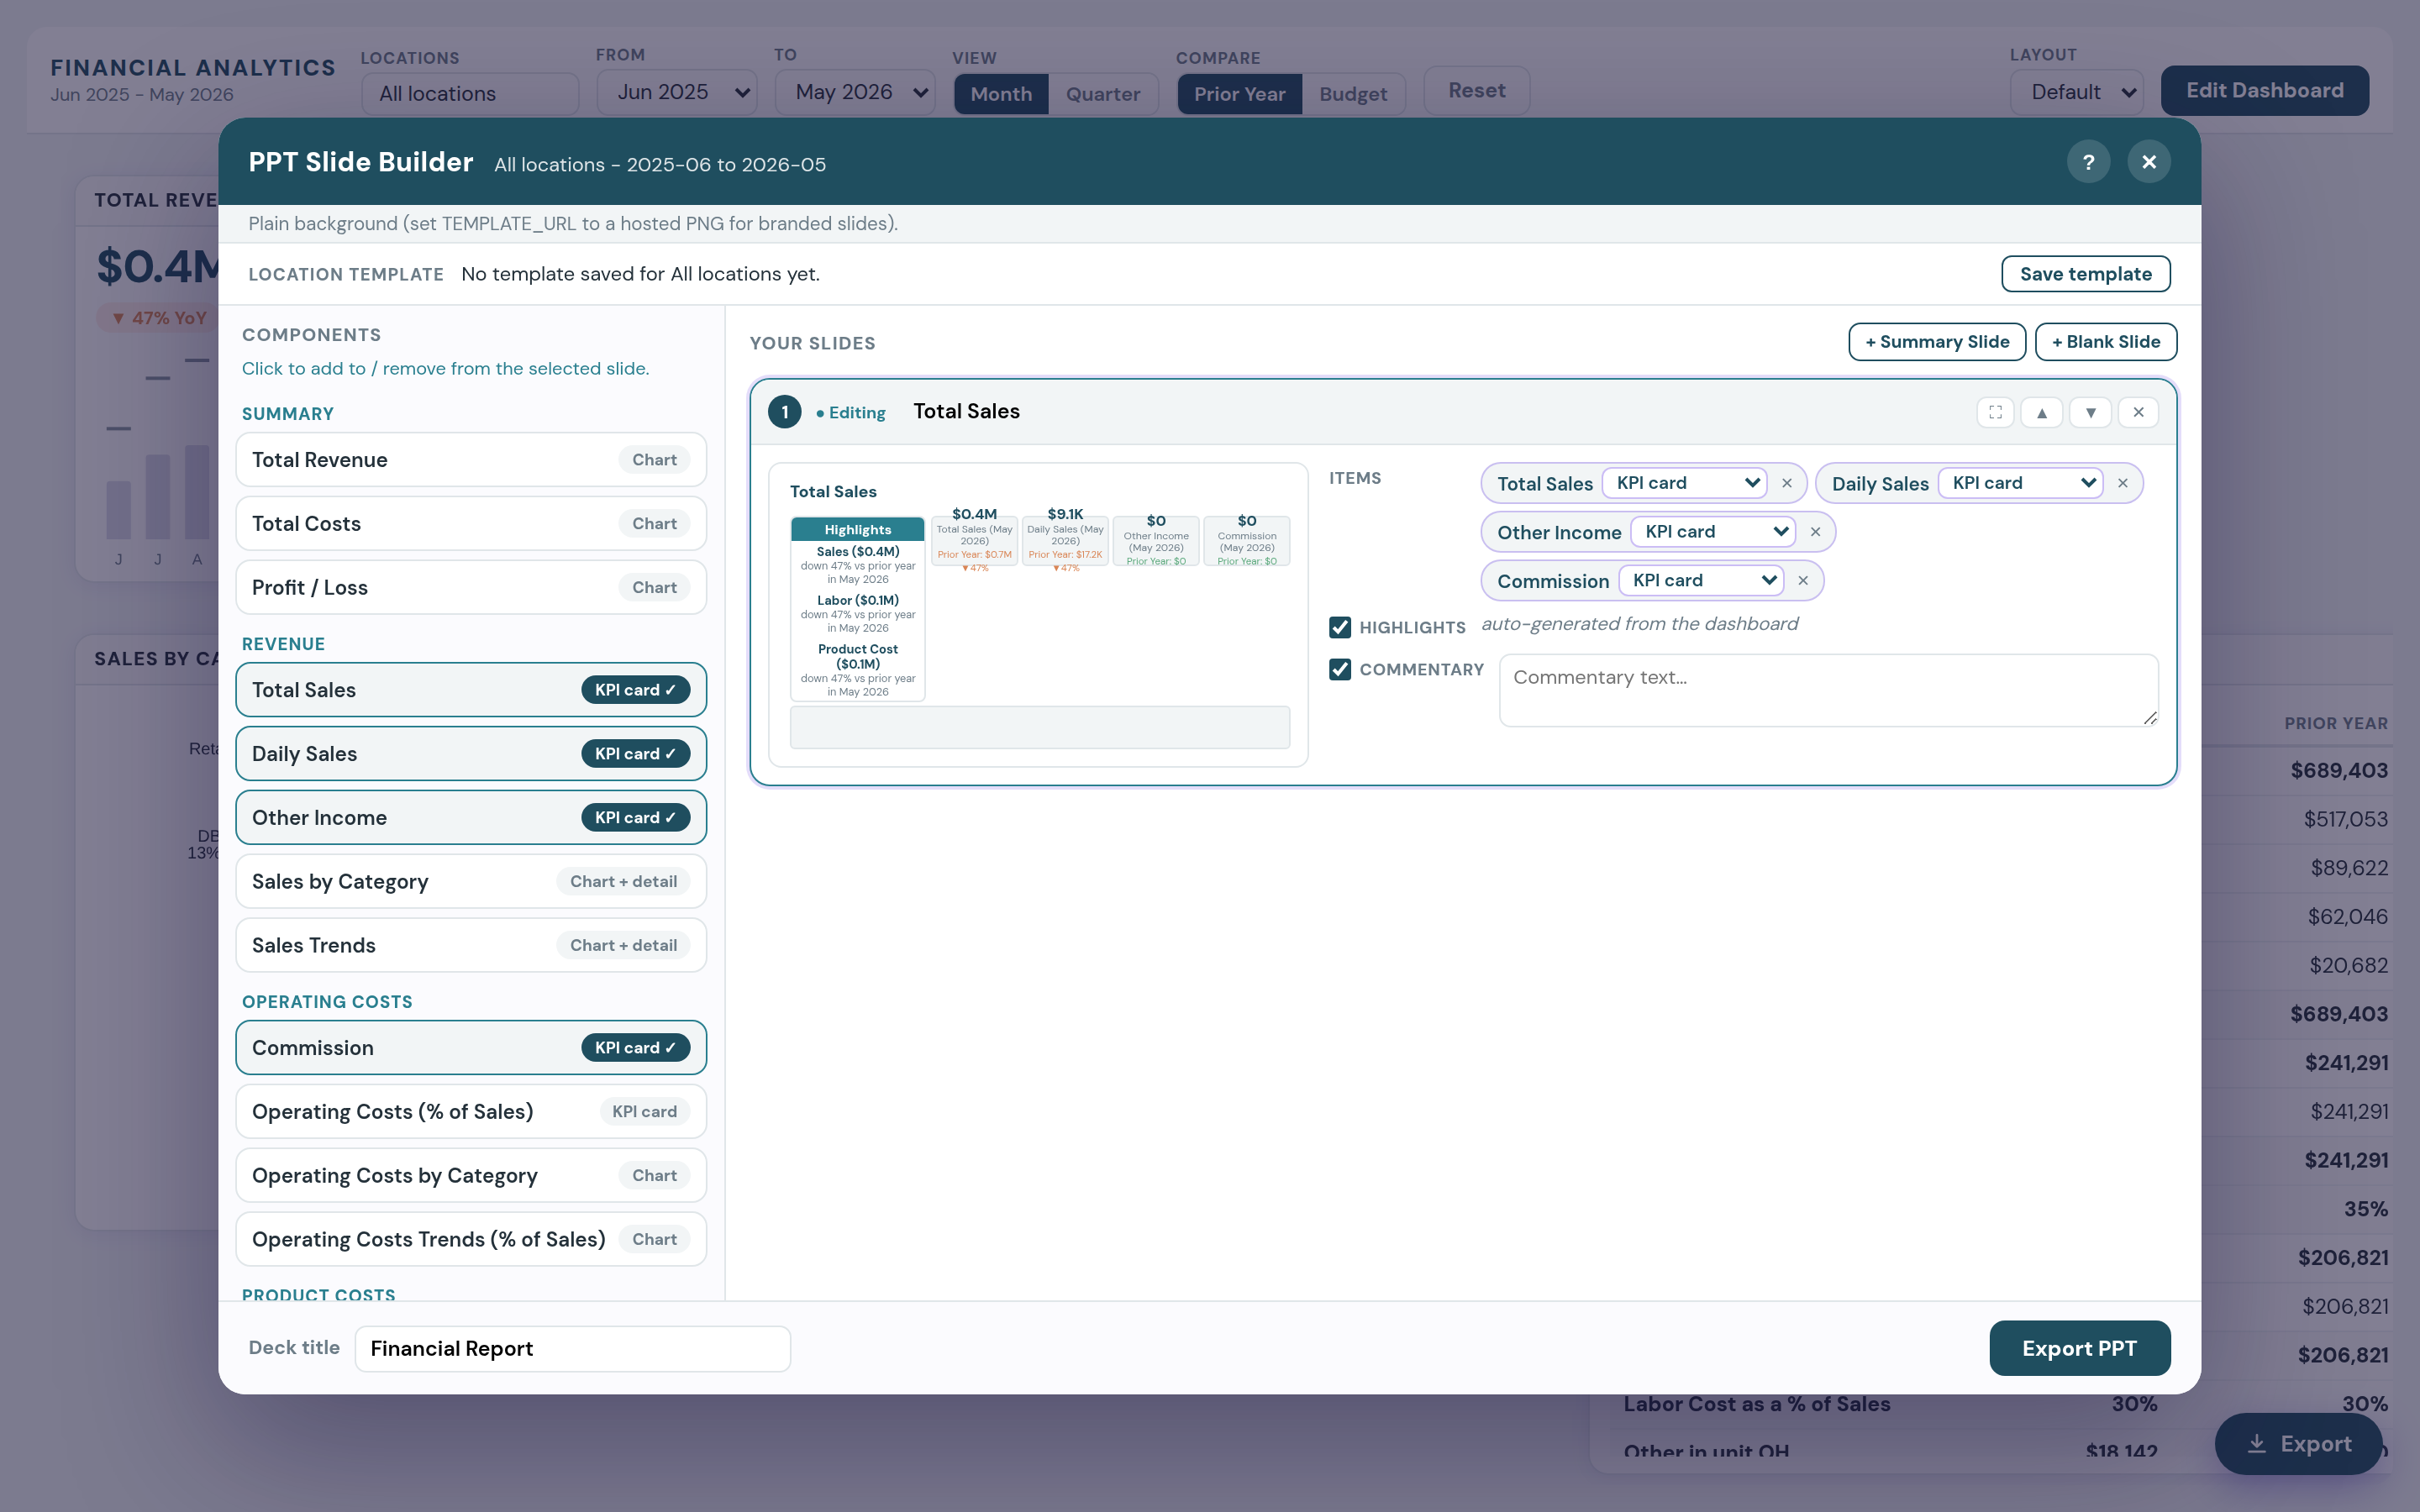
The PowerPoint export block with a slide under construction: the same component catalogue as the editor, four KPI cards placed on a slide, a per-item display-view selector, auto-generated highlights, a commentary field and the export action.

The PowerPoint export block with a slide under construction: the same component catalogue as the editor, four KPI cards placed on a slide, a per-item display-view selector, auto-generated highlights, a commentary field and the export action.

What was anonymized

As above. All slide content derives from the same synthetic mock dataset. The block hardcoded the client wordmark in an export-branding function and the client brand hex for generated slides; both were remapped locally before rendering.

I rebuilt a four-tab Tableau financial workbook as a modular reporting block, so a manager assembles their own dashboard from a component catalogue instead of asking for a new tab.

23reusable dashboard components in the catalogue

The catalogue is the unit of extension: a new metric is a config entry, not new markup, so the block absorbs requests that would otherwise each become a bespoke build.

Computed from source
How this was derived
What this basis means
Derived by counting the artifact itself — files, lines, checks, assets. Reproducible by anyone with repository access.
Working
Counted DOM entries in the rendered component list of the export pane (document.querySelectorAll('#exp-list [data-key]').length = 23). Cross-checked against the editor panel groupings visible in the captured screenshot: Summary 3 + Revenue 5 + Operating Costs 5 + Product Costs 5 + Labor Costs 5 = 23.
Caveat
Counts the catalogue as configured at capture time. Entries can be added without code changes, so the number reflects a snapshot, not a ceiling.
Who can confirm
Analytics consultant who authored the block (self); not independently reviewed.
As of
2026-08-06
4source Tableau dashboard tabs consolidated into one block

Consolidation is what makes the catalogue possible — the four tabs shared a measure set but could not share layout, so users navigated tabs to assemble a view mentally.

Reported
How this was derived
What this basis means
Taken from professional record or supplied by a client, employer, or colleague, rather than measured independently here. The source of each reported figure is named in its caveat.
Working
Taken from the project's own architecture note, which maps the source workbook's Revenue / Operating / Product / Labor tabs onto the component catalogue.
Caveat
Recorded by me during the build from the source workbook, not measured from production telemetry. Wrong if the workbook gained or lost tabs after the note was written.
Who can confirm
Analytics consultant on the engagement (self).
As of
2026-08-06
Evidence
  • artifactModular reporting shell blocknot public

    A single portal HTML block holding the component catalogue, filter bar, drag/resize canvas and per-user saved layouts. Captured running against its own built-in synthetic dataset, so the screenshots show the real interface with no client figures in it.

    Client engagement under commercial confidentiality.

  • artifactMeasure engine ported from the source workbooknot public

    The workbook's calculated fields re-implemented in JavaScript over a single fetch, including the ledger sign convention where revenue rows are stored negative. Included as a code sample.

    Client engagement under commercial confidentiality.

Where it applied
  • A regional manager who only tracks labour cost percentage builds a three-tile layout and stops navigating a four-tab workbook.
  • A new metric is requested; it ships as a catalogue entry rather than a new dashboard tab and a new release.
What it implies

I can take an existing BI artefact apart, find the construct underneath it, and rebuild it as something users extend themselves — rather than porting the same rigidity onto a new platform.

I extended the same component catalogue into a PowerPoint export, so the deck a manager assembles is generated from the components already on their dashboard.

2portal blocks sharing one component registration bus

The dashboard and the exporter stay in step because neither owns the catalogue — adding a component makes it available to both without touching the exporter.

Computed from source
How this was derived
What this basis means
Derived by counting the artifact itself — files, lines, checks, assets. Reproducible by anyone with repository access.
Working
Counted the blocks that register on or read from the shared export bus in the captured page composition: the shell block (registers) and the export block (reads). Both are present in the rendered capture, and the export pane lists the shell's components.
Caveat
Describes the design at capture time. Says nothing about how many components a user actually exports in practice, which I did not measure.
Who can confirm
Analytics consultant who authored both blocks (self).
As of
2026-08-06
Evidence
  • artifactSlide builder blocknot public

    A second block that reads the same registration bus as the dashboard. Each component exposes several display views (KPI card, chart, chart plus detail) and the slide inherits a default view from the component's tile size, with a per-item override.

    Client engagement under commercial confidentiality.

Where it applied
  • A monthly client review deck is rebuilt from the current dashboard rather than re-screenshotted by hand.
  • A manager changes a tile from summary to detailed size and the corresponding slide follows, without re-specifying the slide.
What it implies

I look for the seam that lets one construct serve two features, instead of building the export as a separate pipeline that drifts from the dashboard.

I built an annotation sidebar that attaches comments to a specific dashboard view, deriving the read filter and the write target from one resolved identifier so a saved comment can never be filtered out of its own view.

8months between the production block's creation and its most recent revision

The module was iterated on in production across that window rather than shipped once, which is where the read/write parity and cache-invalidation problems actually surfaced.

Measured
How this was derived
What this basis means
Recorded directly from instrumentation, timings, or logs at the time the work was done.
Working
Read from the portal registry for the production block: created_at 2025-08-06, updated_at 2026-04-08. Elapsed = 2025-08-06 to 2026-04-08 = 8 months and 2 days, reported as 8 months.
Caveat
updated_at records the last write to the block record, which is a proxy for active development, not a measure of it. A single late edit would inflate the window; quiet periods inside it are invisible.
Who can confirm
Portal registry timestamps; not corroborated by a second party.
As of
2026-08-06
Evidence
  • artifactComment and approval module, in productionnot public

    A portable block dropped onto multiple dashboards. Writes go to a base table through the portal's database-modification API; reads come from a downstream view that applies row-level security by username.

    Client engagement under commercial confidentiality.

  • artifactScope-parity and optimistic-write code samplesnot public

    Two of the included samples come from this block: the single resolved scope identifier, and the optimistic insert that deliberately marks its cache incomplete because the server generates the real key.

    Client engagement under commercial confidentiality.

Where it applied
  • A finance reviewer leaves a note against a specific month and filter combination, and the next reviewer opening that same view sees it.
  • A comment added while the downstream read view is mid-refresh still appears immediately, and edit or delete acts on the persisted row rather than a placeholder.
What it implies

I design the data contract so the expensive failure — a write that silently falls outside its own read scope — cannot be represented, rather than testing for it after the fact.

I built a write-back form that lets operators enter budget, ledger and headcount figures into the warehouse from inside the portal, scoped by row-level security.

3input topics the form is configured to accept

One block covers three unrelated data-entry jobs because the form is generated from configuration, so a fourth topic is a configuration row rather than a new form.

Computed from source
How this was derived
What this basis means
Derived by counting the artifact itself — files, lines, checks, assets. Reproducible by anyone with repository access.
Working
Counted distinct TOPIC_KEY values in the block's topic configuration: CLIENT_BUDGET, HEADCOUNT, CLIENT_LEDGER = 3. Confirmed against the rendered Topic dropdown in the capture, which offers exactly those three plus a placeholder.
Caveat
Counts configured topics, not topics in active use. I did not measure how many are actually being written to in production.
Who can confirm
Analytics consultant who authored the block (self).
As of
2026-08-06
3organisational levels a single entry can be scoped to

The same form serves a client-level budget and a single-site headcount count, which is what lets one block replace what would otherwise be separate per-level forms.

Computed from source
How this was derived
What this basis means
Derived by counting the artifact itself — files, lines, checks, assets. Reproducible by anyone with repository access.
Working
Counted distinct HIERARCHY_LEVELS values in the block's topic configuration (CLIENT, COMPLEX, UNIT = 3), confirmed against the rendered Hierarchy dropdown in the capture.
Caveat
Levels available are per-topic; not every topic offers all three. The figure is the size of the union, not a guarantee for any one topic.
Who can confirm
Analytics consultant who authored the block (self).
As of
2026-08-06
Evidence
  • artifactData input blocknot public

    A configuration-driven form: topic, input type, date grain, date range and organisational level are chosen first, and the entry grid is generated from that combination. Captured with all reference entities replaced by synthetic equivalents.

    Client engagement under commercial confidentiality; the real reference data is client organisational structure.

Where it applied
  • A unit manager enters next year's budget by category without a spreadsheet round-trip through the data team.
  • Headcount is captured at site level on a daily grain while budget is captured at client level monthly, through the same interface.
What it implies

I treat a form as generated output of a configuration table, which is what stops the fourth request from becoming the fourth codebase.

I worked inside an established multi-tenant analytics portal rather than a greenfield one, adding blocks alongside years of existing content.

268content blocks in the portal

New work had to compose with a large existing surface, which is why the blocks I added are drop-in and resolve their own configuration rather than depending on per-page wiring.

Computed from source
How this was derived
What this basis means
Derived by counting the artifact itself — files, lines, checks, assets. Reproducible by anyone with repository access.
Working
Registry listing of the block resource returned total = 268 with truncated = false, so this is a complete count rather than a page of results.
Caveat
Counts every block in the portal regardless of author. It is a measure of the environment I worked in, NOT a count of blocks I personally built — the registry listing exposes no author field, so I cannot attribute them.
Who can confirm
Portal resource registry.
As of
2026-08-06
88pages in the portal

Indicates the breadth of the reporting estate the new blocks had to sit within.

Computed from source
How this was derived
What this basis means
Derived by counting the artifact itself — files, lines, checks, assets. Reproducible by anyone with repository access.
Working
Registry listing of the layout resource returned total = 88 with truncated = false.
Caveat
Includes demonstration and development pages as well as production ones; I did not separate them, and the split is not derivable from the listing.
Who can confirm
Portal resource registry.
As of
2026-08-06
104blocks created portal-wide in the trailing twelve months

Shows the portal was under active development throughout, not in maintenance — the environment kept moving while the new work landed in it.

Computed from source
How this was derived
What this basis means
Derived by counting the artifact itself — files, lines, checks, assets. Reproducible by anyone with repository access.
Working
Retrieved created_at for all 268 blocks from the registry and counted those with created_at >= 2025-08-06, against a most recent record of 2026-08-05. Result: 104 of 268.
Caveat
Portal-wide activity by all contributors, not my output. Block creation also counts trivial blocks (titles, reset buttons) equally with substantial ones, so it measures activity rather than effort.
Who can confirm
Portal resource registry timestamps.
As of
2026-08-06
Evidence
  • artifactPortal registry inventorynot public

    Counts taken directly from the portal's own resource registry across pages, blocks and data sources.

    Client engagement under commercial confidentiality; page and block names identify the client and its end customers.

Where it applied
  • A new module has to be droppable onto any of several dashboards without a per-page data binding being hand-configured first.
  • Work proceeds against a platform whose own version constraints differ between the client's production portal and the development portal.
What it implies

I am comfortable delivering into an existing, actively-changing system with other people's code in it, which is a different skill from building something new in isolation.

479

individual HTML blocks in the portal

Embedded reporting blocks for a consultancy

Delivered for a data-and-analytics consultancy that builds embedded, customer-facing reporting portals for enterprise clients.

Client-confidentialAnalytics Implementation Manager · 2025-20264 metrics · 1 screenshotsee the proof ▾

Offered as proof of: Client-facing analytics delivery: turning an operational question into an interface non-analysts use daily.

  • Zuar Portal
  • JavaScript
  • ECharts 5
  • SQL
  • PostgreSQL

Interface

Real interface, synthetic data — every value replaced before capture

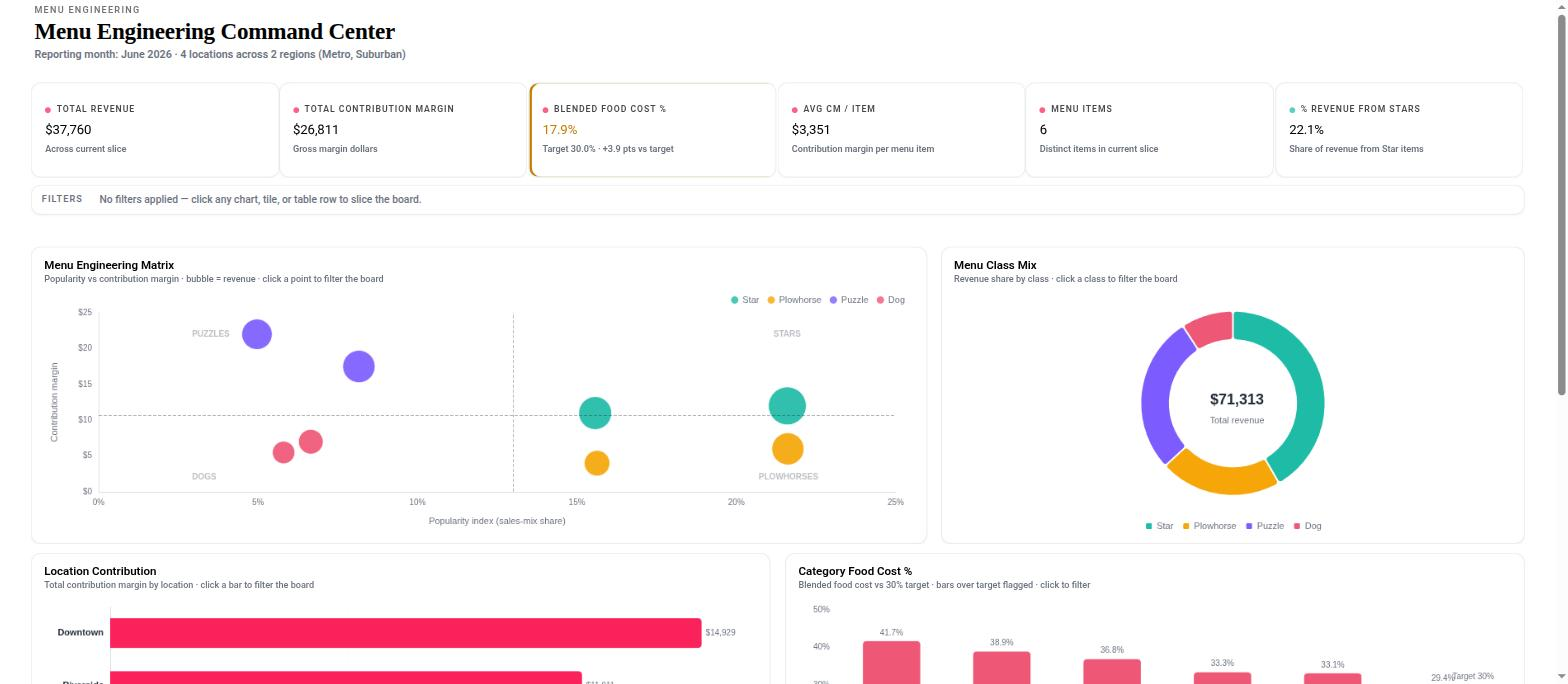
A menu-engineering board: KPI band, popularity-vs-contribution-margin quadrant scatter with click-to-filter, revenue-share donut, contribution-by-location and food-cost-by-category bars

A menu-engineering board: KPI band, popularity-vs-contribution-margin quadrant scatter with click-to-filter, revenue-share donut, contribution-by-location and food-cost-by-category bars

What was anonymized

None needed, and none applied. The page renders full-bleed with no sidebar, top nav, logo or signed-in user chip in frame. All values come from the portal's own `menu_item_performance_sample` datasource — fabricated by construction, so no substitution was required. Locations read `Downtown`/`Riverside`; no real entity appears. No cursor in frame.

I built dashboard boards as many small self-contained blocks — one tile per file, each reading its own bound query — rather than as a few large pages sharing a JavaScript bundle.

479individual HTML blocks in the portal

Tile-level granularity is what makes a board recomposable — a KPI or chart can be moved between pages without touching the pages it leaves or joins.

Computed from source
How this was derived
What this basis means
Derived by counting the artifact itself — files, lines, checks, assets. Reproducible by anyone with repository access.
Working
The `total` field returned by the portal's block list endpoint on 2026-08-06 (GET blocks, unfiltered). Not a sample or an estimate — it is the registry's own count of all block records.
Caveat
This is the count of blocks present in the portal, not the count authored by any one person. The portal is a shared internal workspace and block names indicate at least three contributors, plus duplicated 'Copy of ...' records and abandoned test blocks. Authorship of any specific subset is not determinable from the portal API and must be confirmed by the portfolio owner before this number is published as personal output.
Who can confirm
Portal administrator (the account this capture authenticated as).
As of
2026-08-06
120pages composed from those blocks

Shows the block library is actually exercised across many boards rather than being a handful of bespoke pages.

Computed from source
How this was derived
What this basis means
Derived by counting the artifact itself — files, lines, checks, assets. Reproducible by anyone with repository access.
Working
The `total` field returned by the portal's layout list endpoint on 2026-08-06, cross-checked against the 120 enumerated records in the same response.
Caveat
Includes development scratch pages, explicit 'Copy of ...' duplicates and pages named as broken ('- BROKE'). A count of finished, in-use boards would be materially lower and was not separately established.
Who can confirm
Portal administrator (the account this capture authenticated as).
As of
2026-08-06
Evidence
  • artifactBlock librarynot public

    The portal's block and page registries, read through its management API. Each block is an independent HTML+JS unit with its own query binding, and pages are compositions of those blocks. Composition is visible in the page-to-block placement records.

    Client engagement under commercial confidentiality.

Where it applied
  • Reusing a KPI tile across several sector boards by rebinding it to a different query rather than rewriting it.
  • Replacing one chart on a live board without redeploying or retesting the rest of the page.
What it implies

Comfortable decomposing a dashboard into independently bound, independently replaceable units — the same instinct that keeps component-based front ends maintainable.

I wrote the data-access layer to tolerate every payload shape the platform can return, so tiles kept rendering across a platform version change instead of silently going blank.

3distinct query payload shapes handled by one accessor

The failure mode being defended against is not an exception but an empty render — the most expensive kind of bug to trace, because nothing reports it.

Computed from source
How this was derived
What this basis means
Derived by counting the artifact itself — files, lines, checks, assets. Reproducible by anyone with repository access.
Working
Counted directly from the branches of the helper as stored in the portal: (1) `mappedData` already an array, (2) `data` rows as positional arrays zipped against normalised column names, (3) `data` rows already keyed objects returned unchanged.
Caveat
Three is the number of shapes the code defends against, not a proof that the platform emits exactly three. A fourth shape in a future version would not be covered.
Who can confirm
Block source held in the portal's own version-control mirror.
As of
2026-08-06
Evidence
  • artifactShape-agnostic query mappernot public

    A `getQueryData` helper repeated across chart and KPI blocks. It short-circuits on a host-mapped payload, normalises column metadata that may be plain strings or objects, and zips positional row arrays into keyed objects only when the rows are not already keyed. Reproduced in the code samples with identifiers stripped.

    Client engagement under commercial confidentiality.

Where it applied
  • A platform upgrade that changed how column metadata is expressed, where tiles using the helper needed no edit.
  • Numeric columns arriving as strings from some database drivers, coerced at the point of arithmetic rather than assumed.
What it implies

Writes to the contract the system actually honours rather than the one the documentation promises, and treats a silent empty result as a bug worth designing against.

I fixed a cross-filtering board so that clicking a point filters every other tile but never filters away the chart you clicked in.

Evidence
  • artifactSelf-filter exclusion on a scatter tilenot public

    The tile's query binding carries a blacklist filter strategy naming its own dimension, so it receives every board filter except one on the column it publishes. Paired with click-to-toggle state, this keeps the selection both visible and reversible from the chart itself.

    Client engagement under commercial confidentiality.

Where it applied
  • A quadrant scatter used as the board's primary selector, where collapsing to the single selected point would have stranded the user with no way to clear the filter.
What it implies

Solves an interaction problem at the data-binding layer where it belongs, instead of patching around it in rendering code.

Before building a multi-query board I wrote a disposable inspector block that reports what each bound query slot actually contains, and worked from that instead of from documentation.

13query slots bound to a single inspector block and probed in one pass

Establishes the real data contract for an entire board in one read, before any rendering code is committed to a shape.

Computed from source
How this was derived
What this basis means
Derived by counting the artifact itself — files, lines, checks, assets. Reproducible by anyone with repository access.
Working
Length of the `ui_queries` array on the inspector block record as stored in the portal (13 enabled bindings, each with a distinct query id), read on 2026-08-06.
Caveat
Counts bindings configured on the block, not slots confirmed to return rows; the block's own purpose is to distinguish those two, and its output was not captured here.
Who can confirm
Portal administrator (the account this capture authenticated as).
As of
2026-08-06
Evidence
  • artifactBound-query inspector blocknot public

    A diagnostic tile that walks every bound query slot and prints, per slot, the row count and each column's index, name and type inferred from the first non-null value across a 100-row scan. Empty slots are reported as findings rather than skipped.

    Client engagement under commercial confidentiality.

Where it applied
  • Verifying which of a dozen bound queries survived a platform upgrade before rebuilding the board on top of them.
  • Catching numeric columns delivered as strings early, rather than after a chart renders a wrong total.
What it implies

Will spend time building throwaway instrumentation to remove guesswork, which is usually cheaper than debugging the guesses later.

162

custom dashboard blocks inventoried

Contact-centre adoption analytics

Delivered for a workforce-automation vendor serving enterprise contact centres.

Client-confidentialAnalytics Implementation Manager · 202612 metrics · 5 screenshotssee the proof ▾

Offered as proof of: Client-facing analytics delivery: turning an operational question into an interface non-analysts use daily.

  • Zuar Portal
  • Zuar Runner (ETL)
  • PostgreSQL
  • SQL
  • JavaScript
  • Chart.js

Interface

Real interface, synthetic data — every value replaced before capture

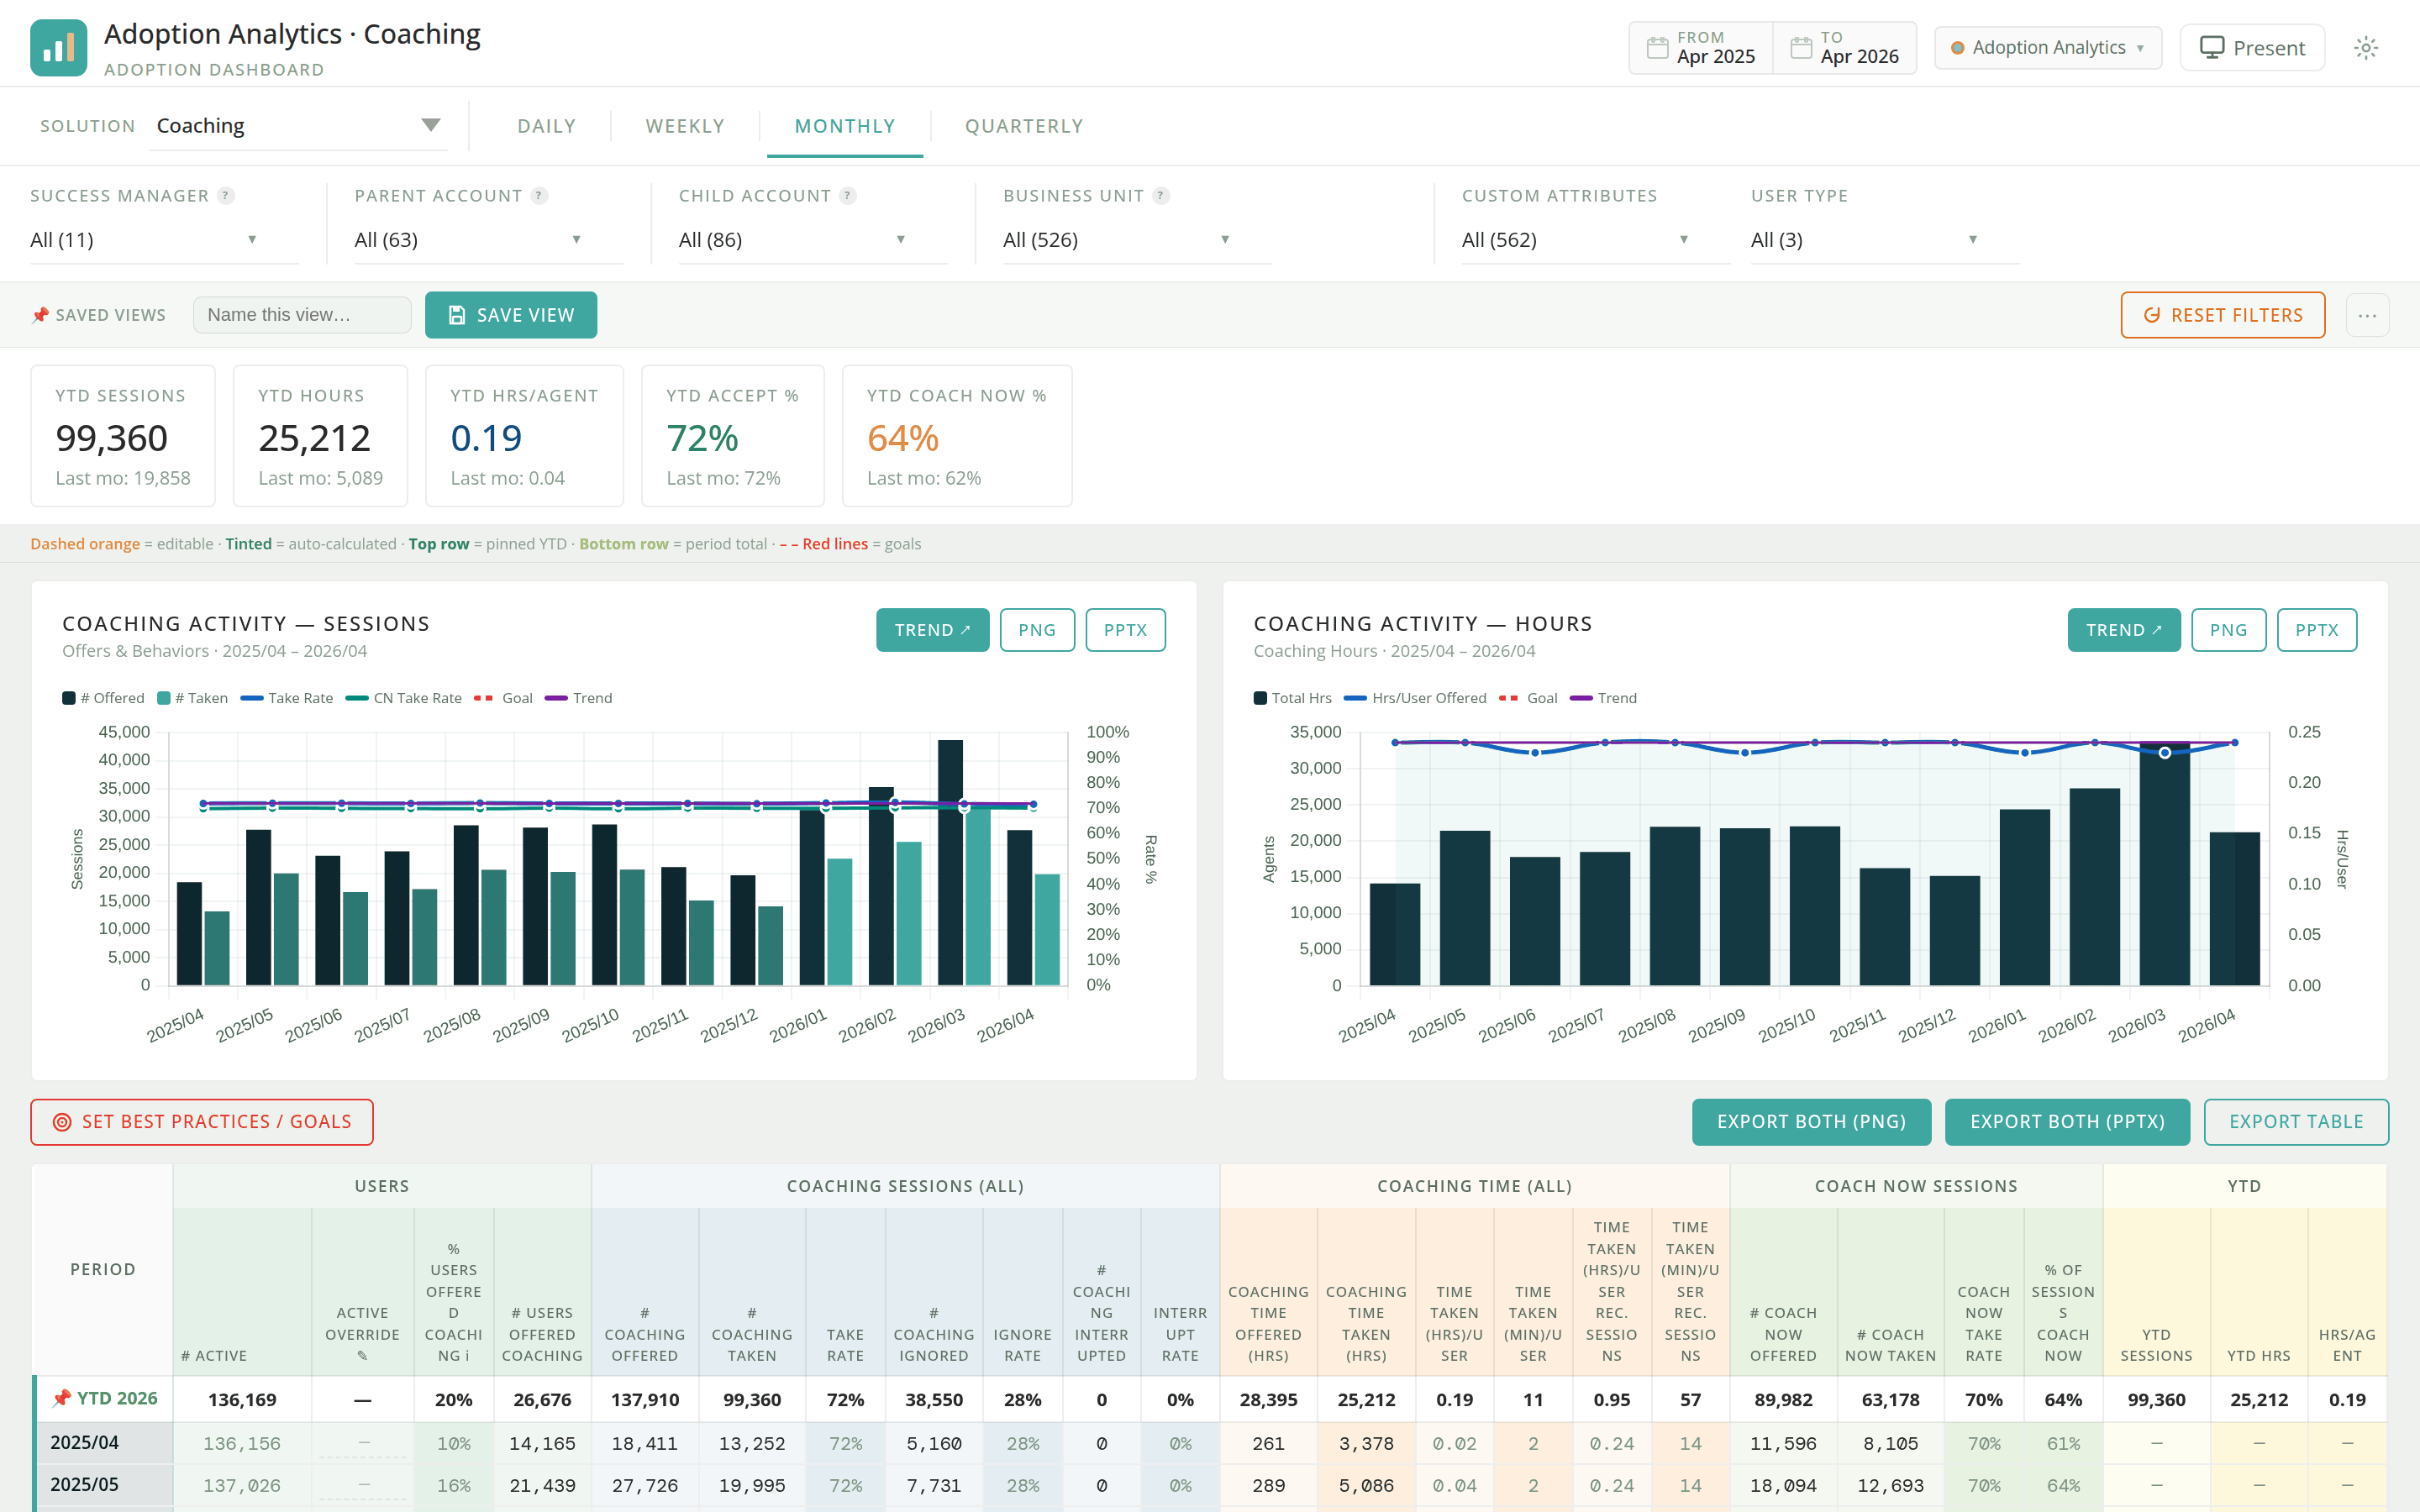
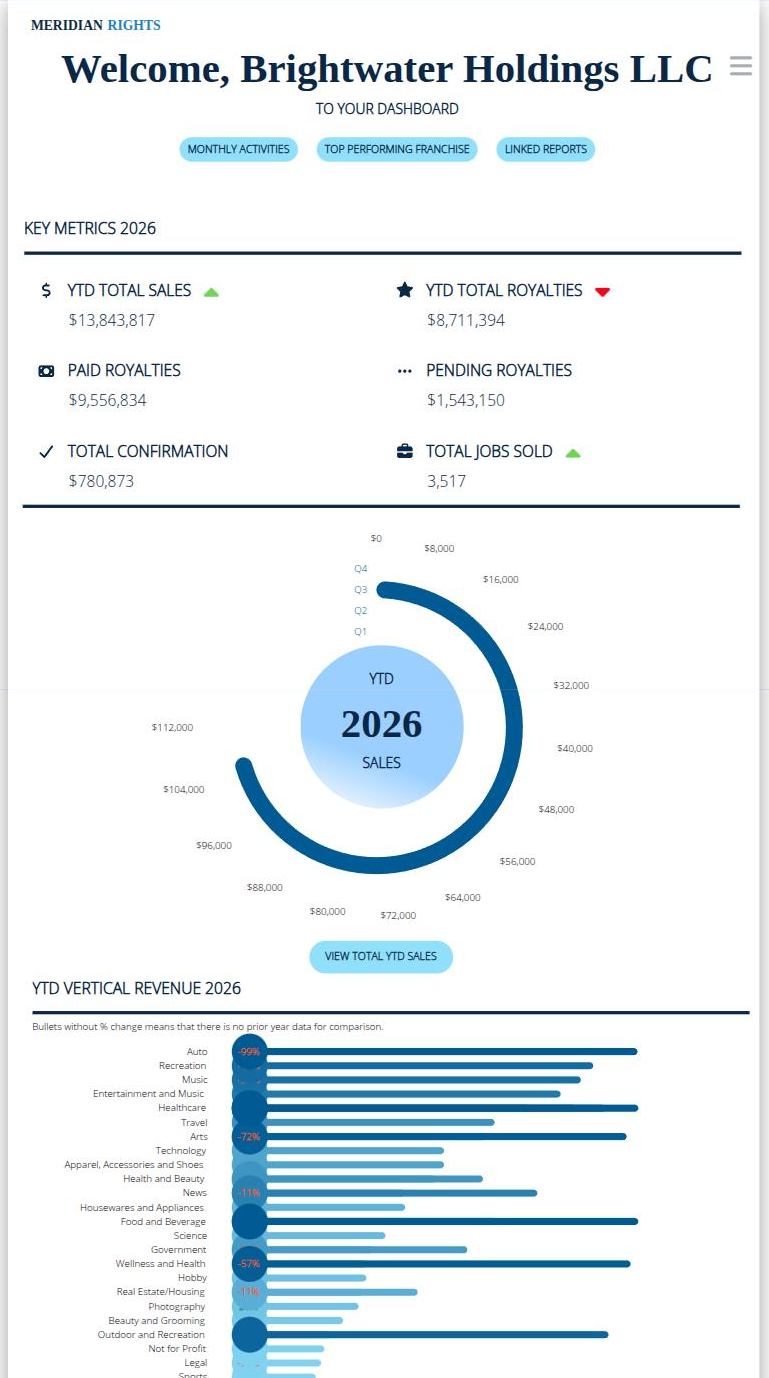
The primary adoption view: cascading filter bar, five KPI tiles, dual-axis sessions and hours charts, head of the metrics table. The page that justified the build.

The primary adoption view: cascading filter bar, five KPI tiles, dual-axis sessions and hours charts, head of the metrics table. The page that justified the build.

What was anonymized

Client wordmark and product name replaced; brand palette swapped for a neutral one; all 86 account names, 63 parent groups and 11 named staff replaced with synthetic equivalents preserving group structure; all values synthetic.

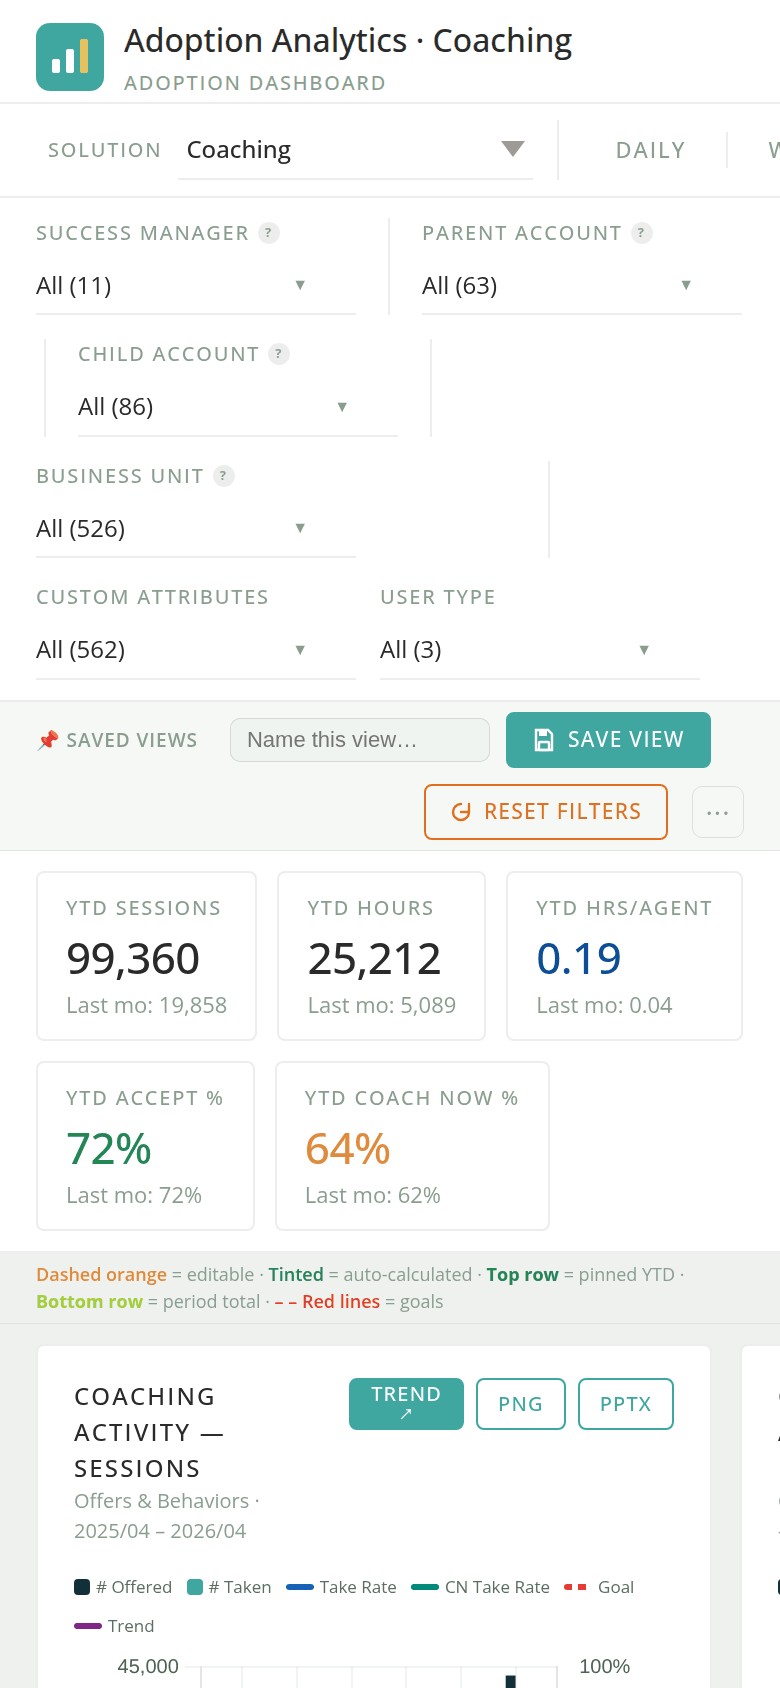
Responsive proof at 390×844: filter grid reflows to two columns, KPI tiles wrap, charts stack.

Responsive proof at 390×844: filter grid reflows to two columns, KPI tiles wrap, charts stack.

What was anonymized

As above.

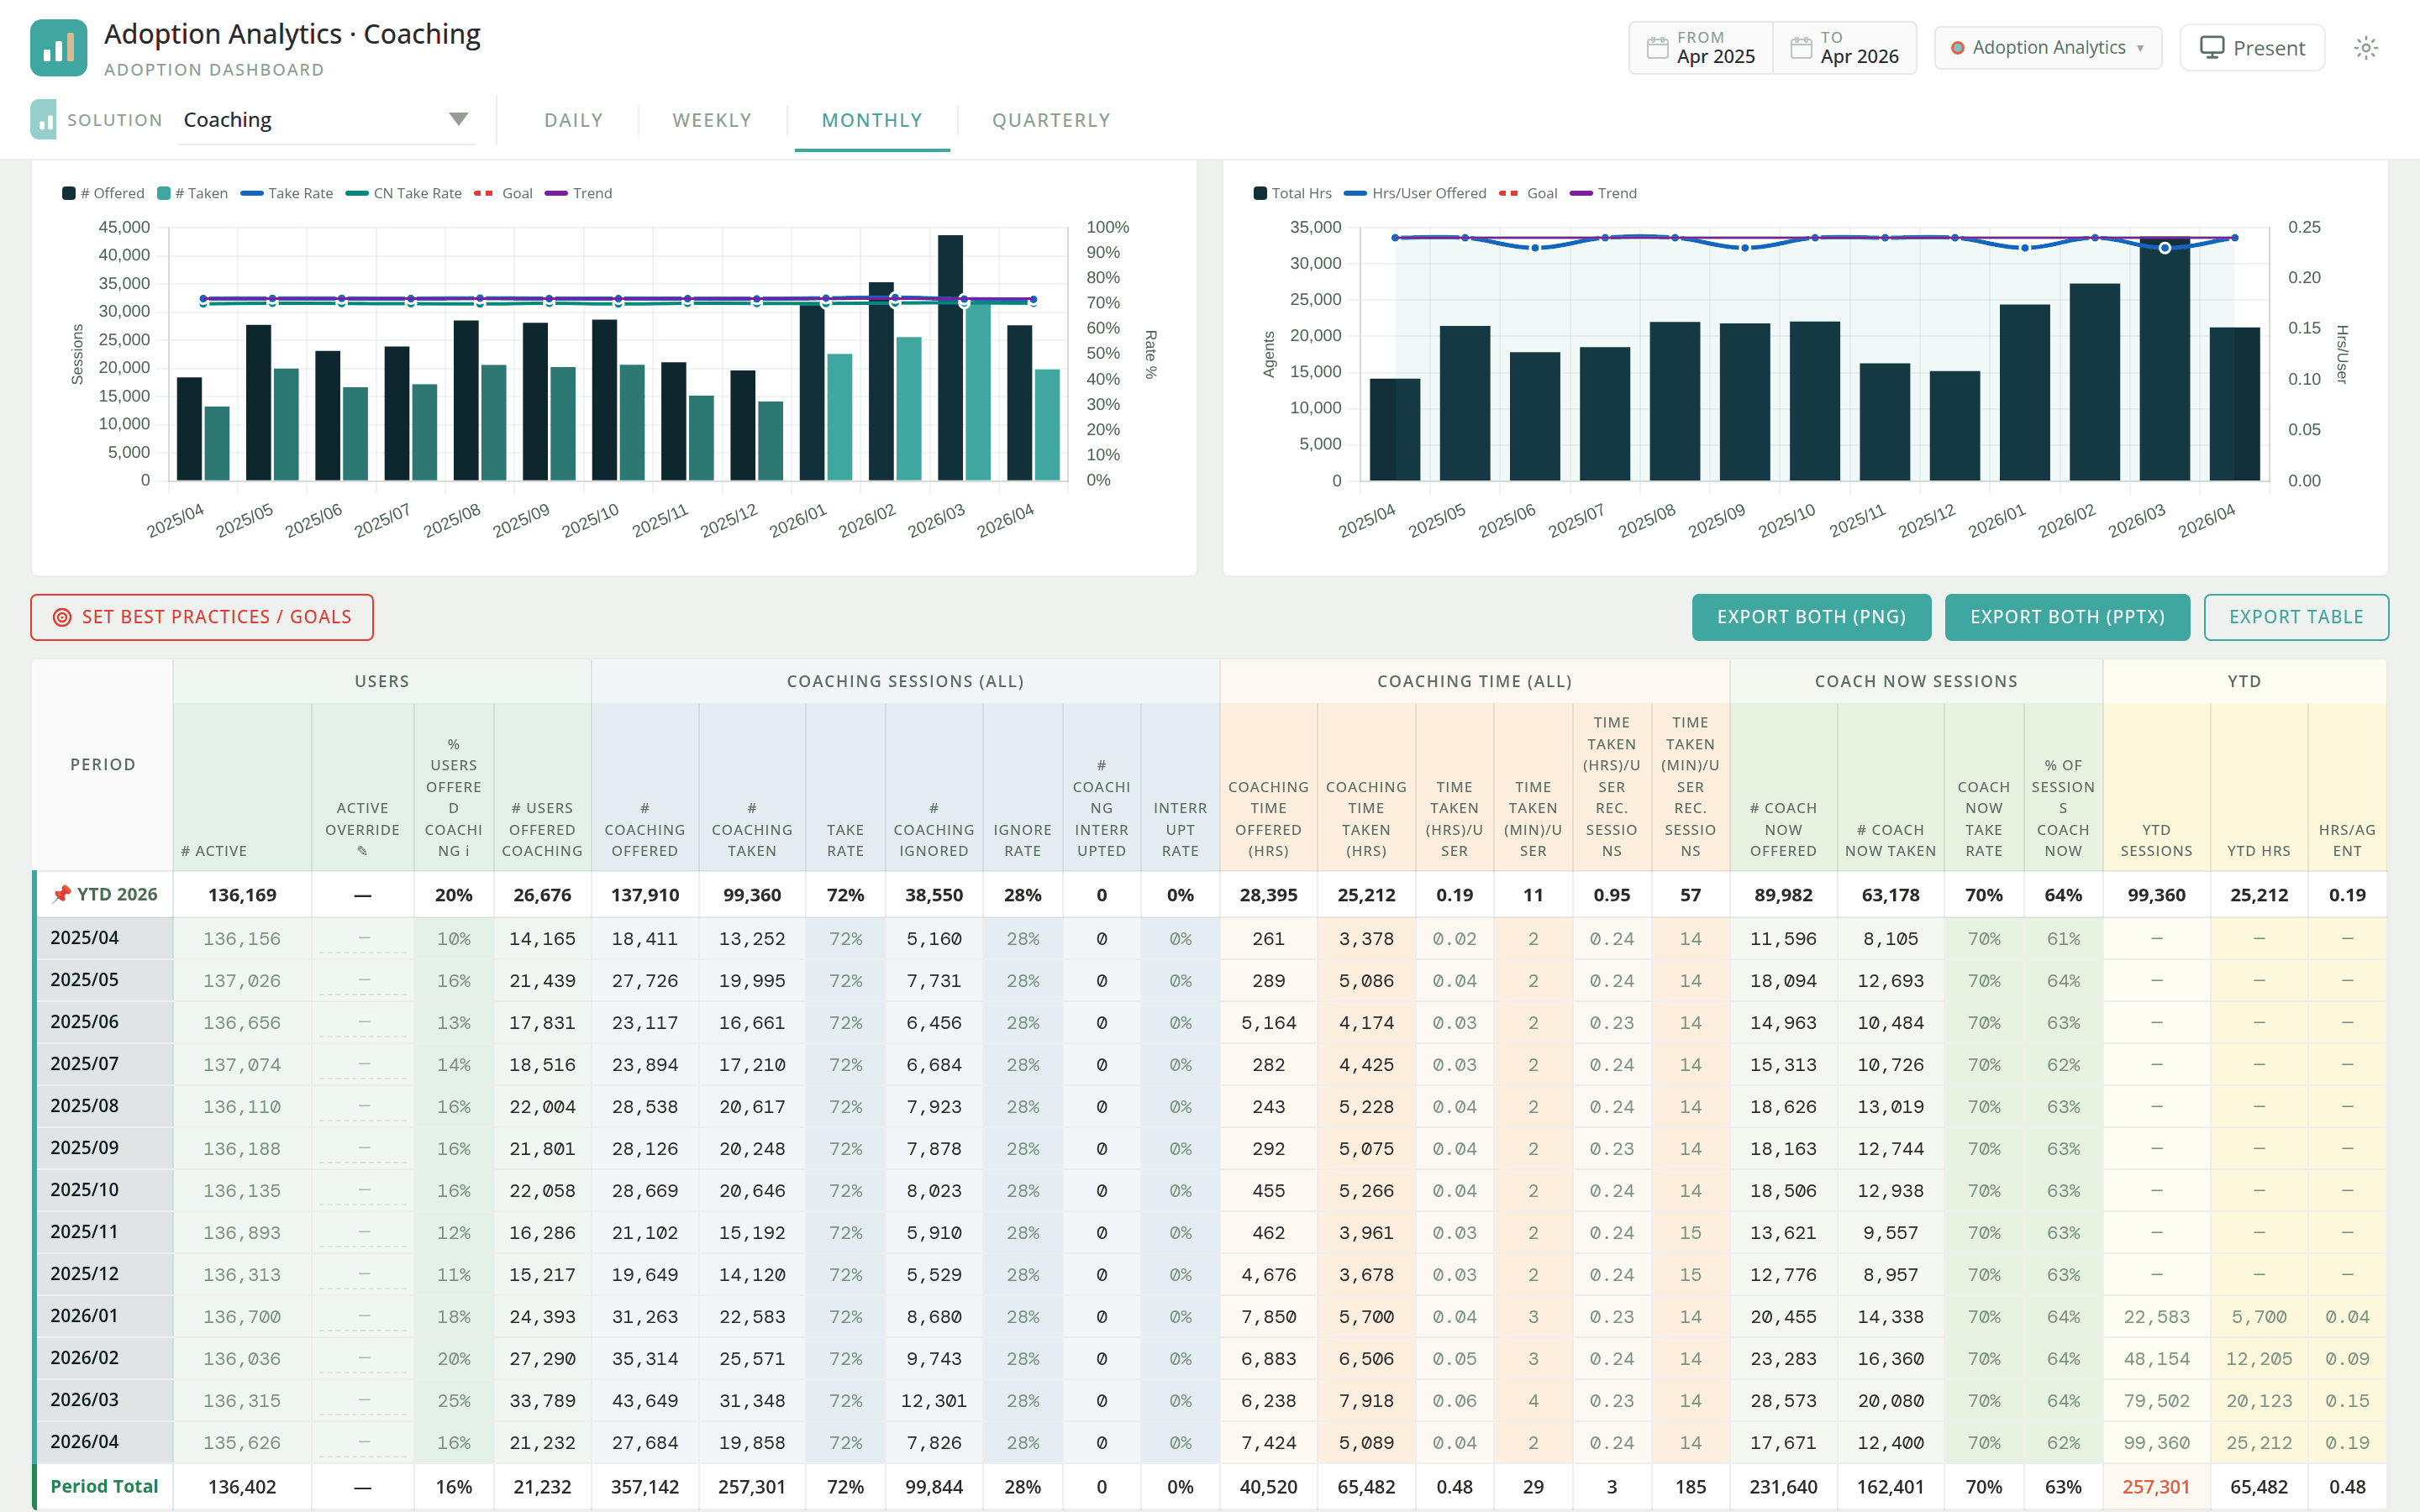
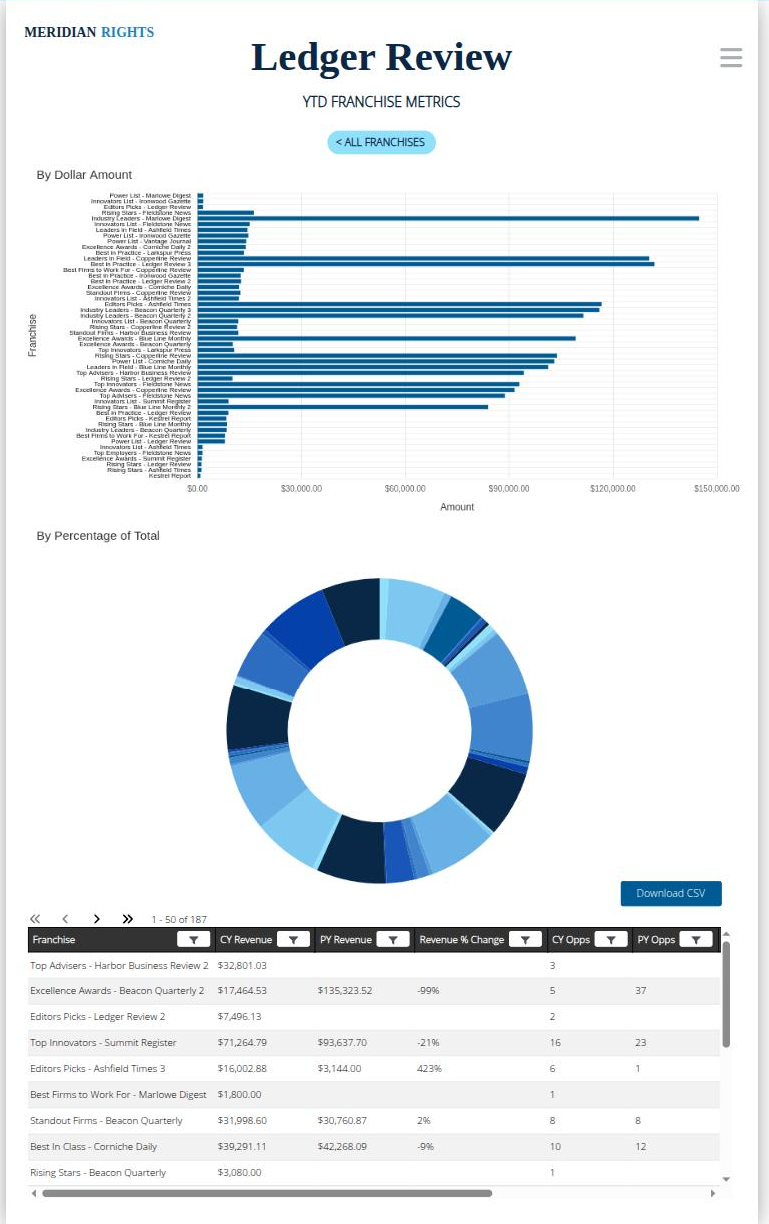
The 29-column metrics table under 7 grouped headers, with the editable manual-headcount override column, pinned year-to-date row and period total. The custom work the stock product does not do.

The 29-column metrics table under 7 grouped headers, with the editable manual-headcount override column, pinned year-to-date row and period total. The custom work the stock product does not do.

What was anonymized

As above. Table values synthetic with invariants preserved.

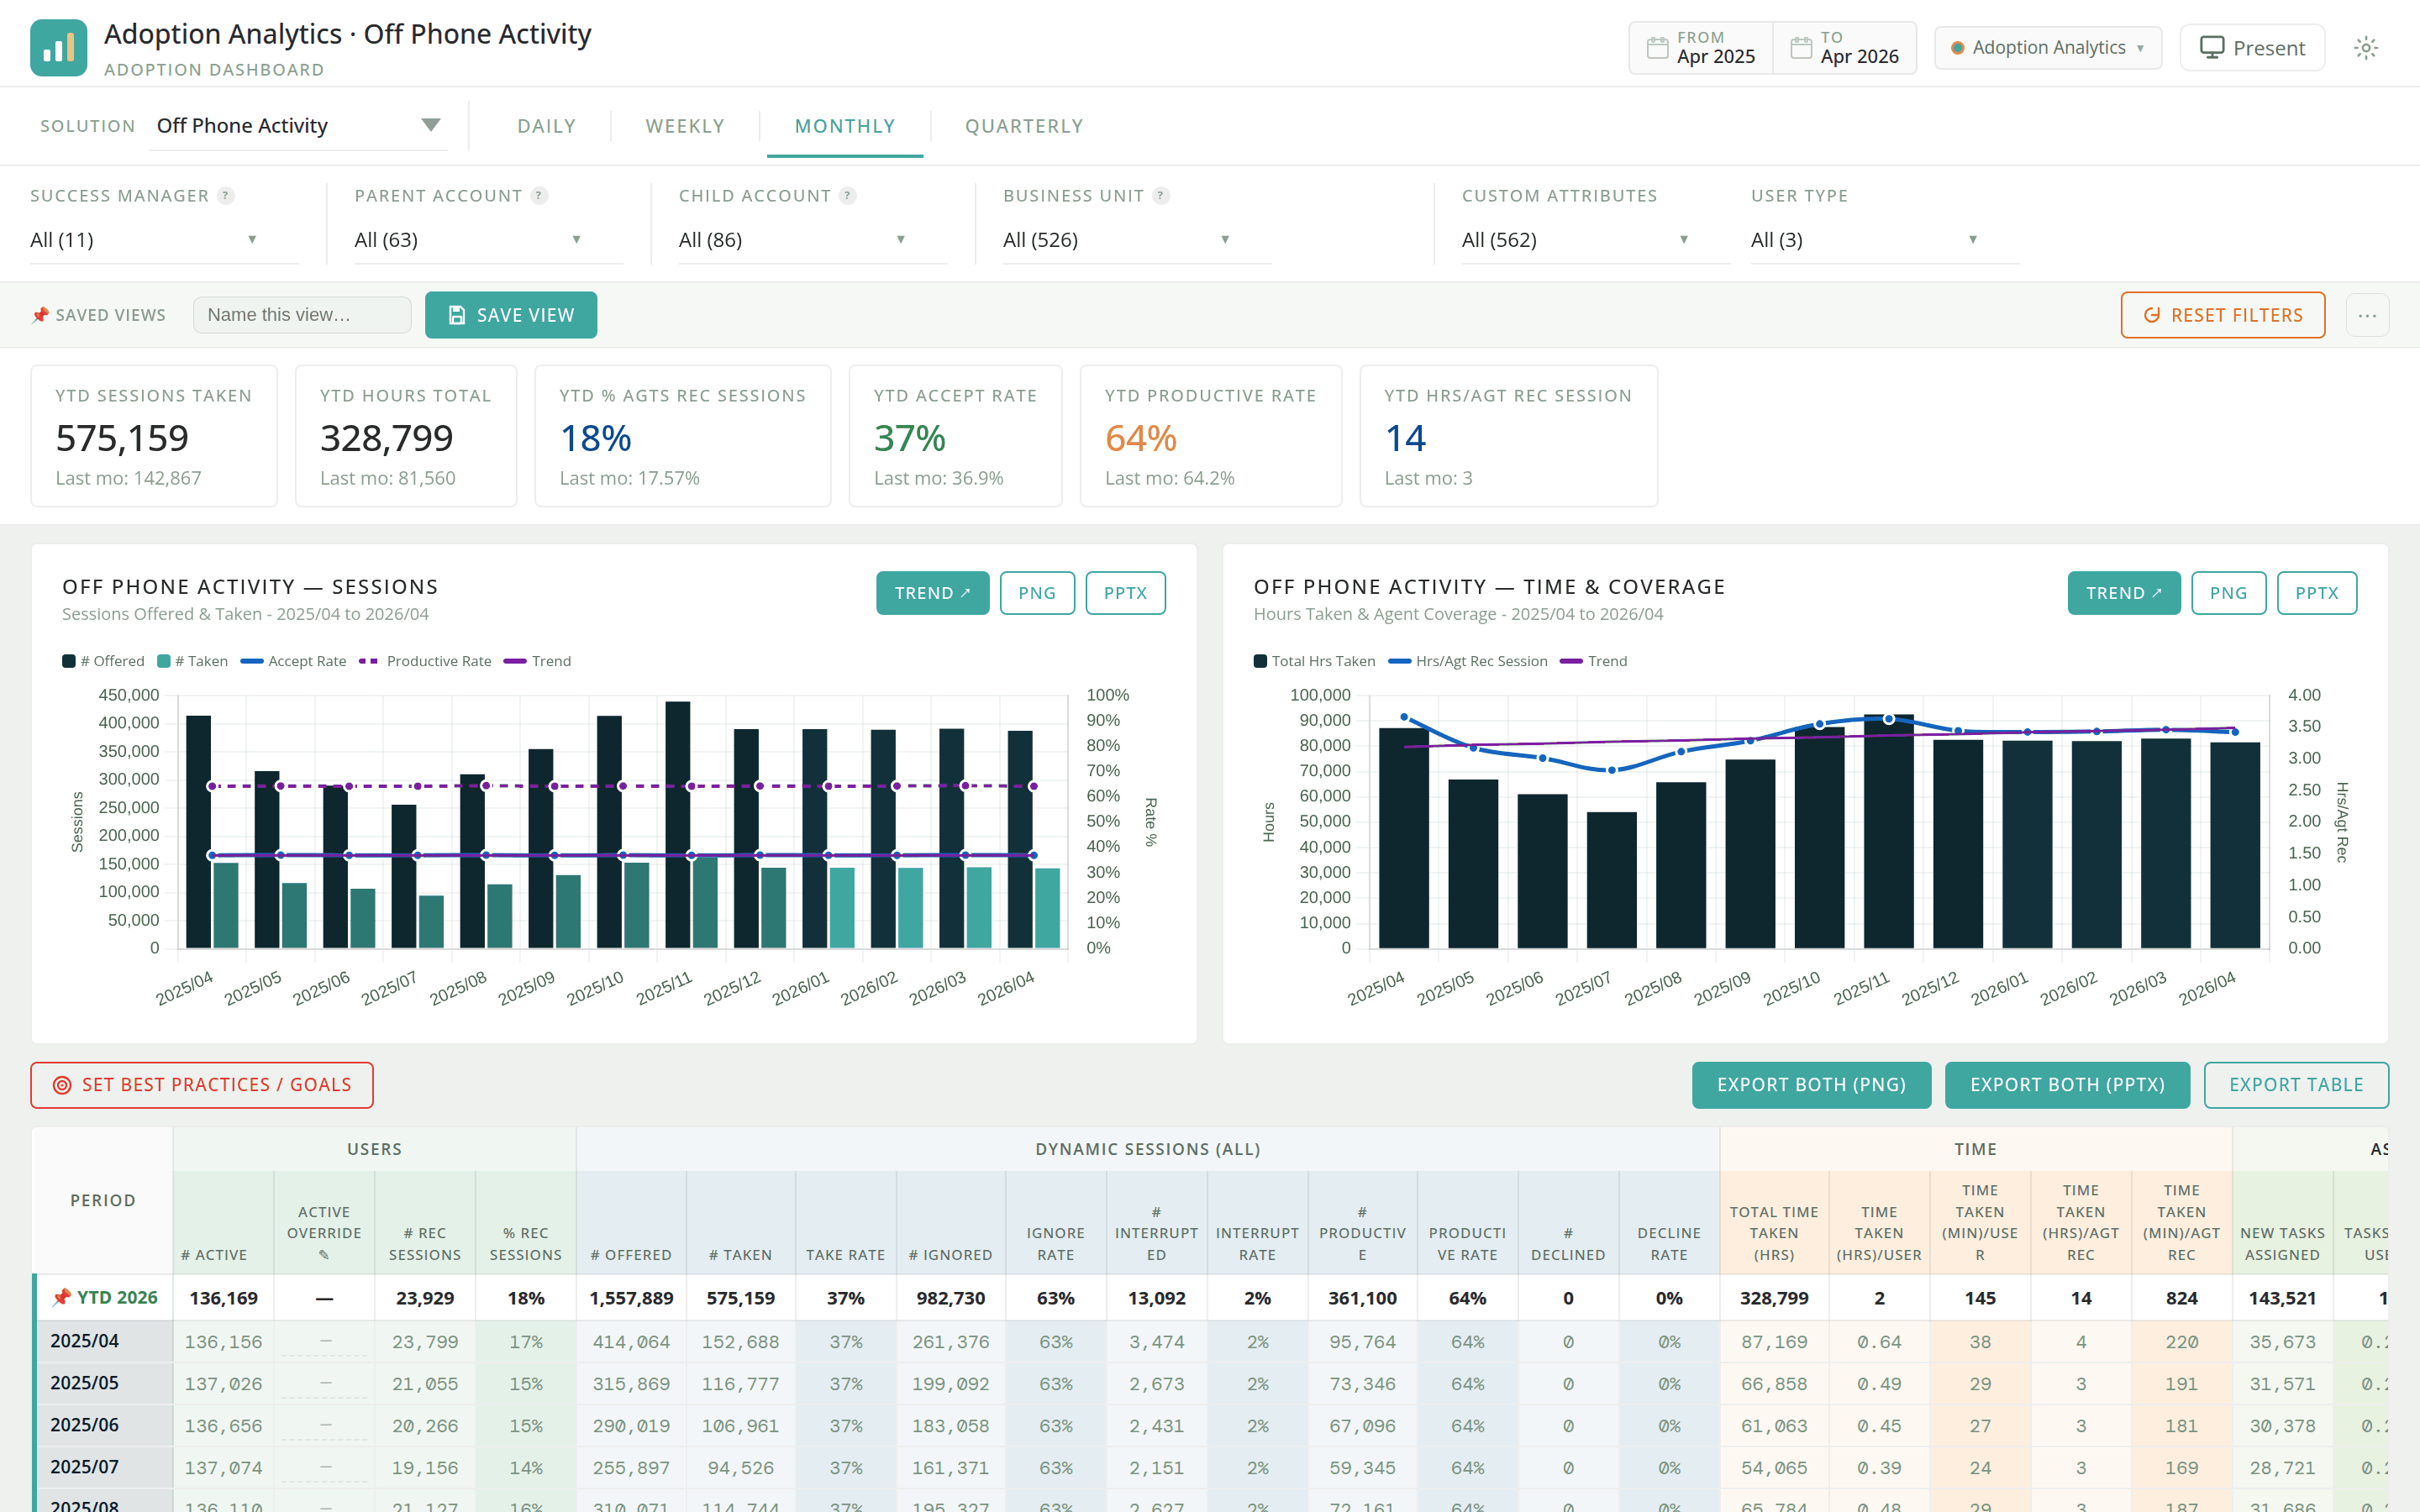
The second solution pane — same shell and filter model, a different metric set (offered/taken/ignored/interrupted/productive, task completion).

The second solution pane — same shell and filter model, a different metric set (offered/taken/ignored/interrupted/productive, task completion).

What was anonymized

As above. Generator rate bands shifted, since this module's own comments noted its rates were derived from real historical actuals.

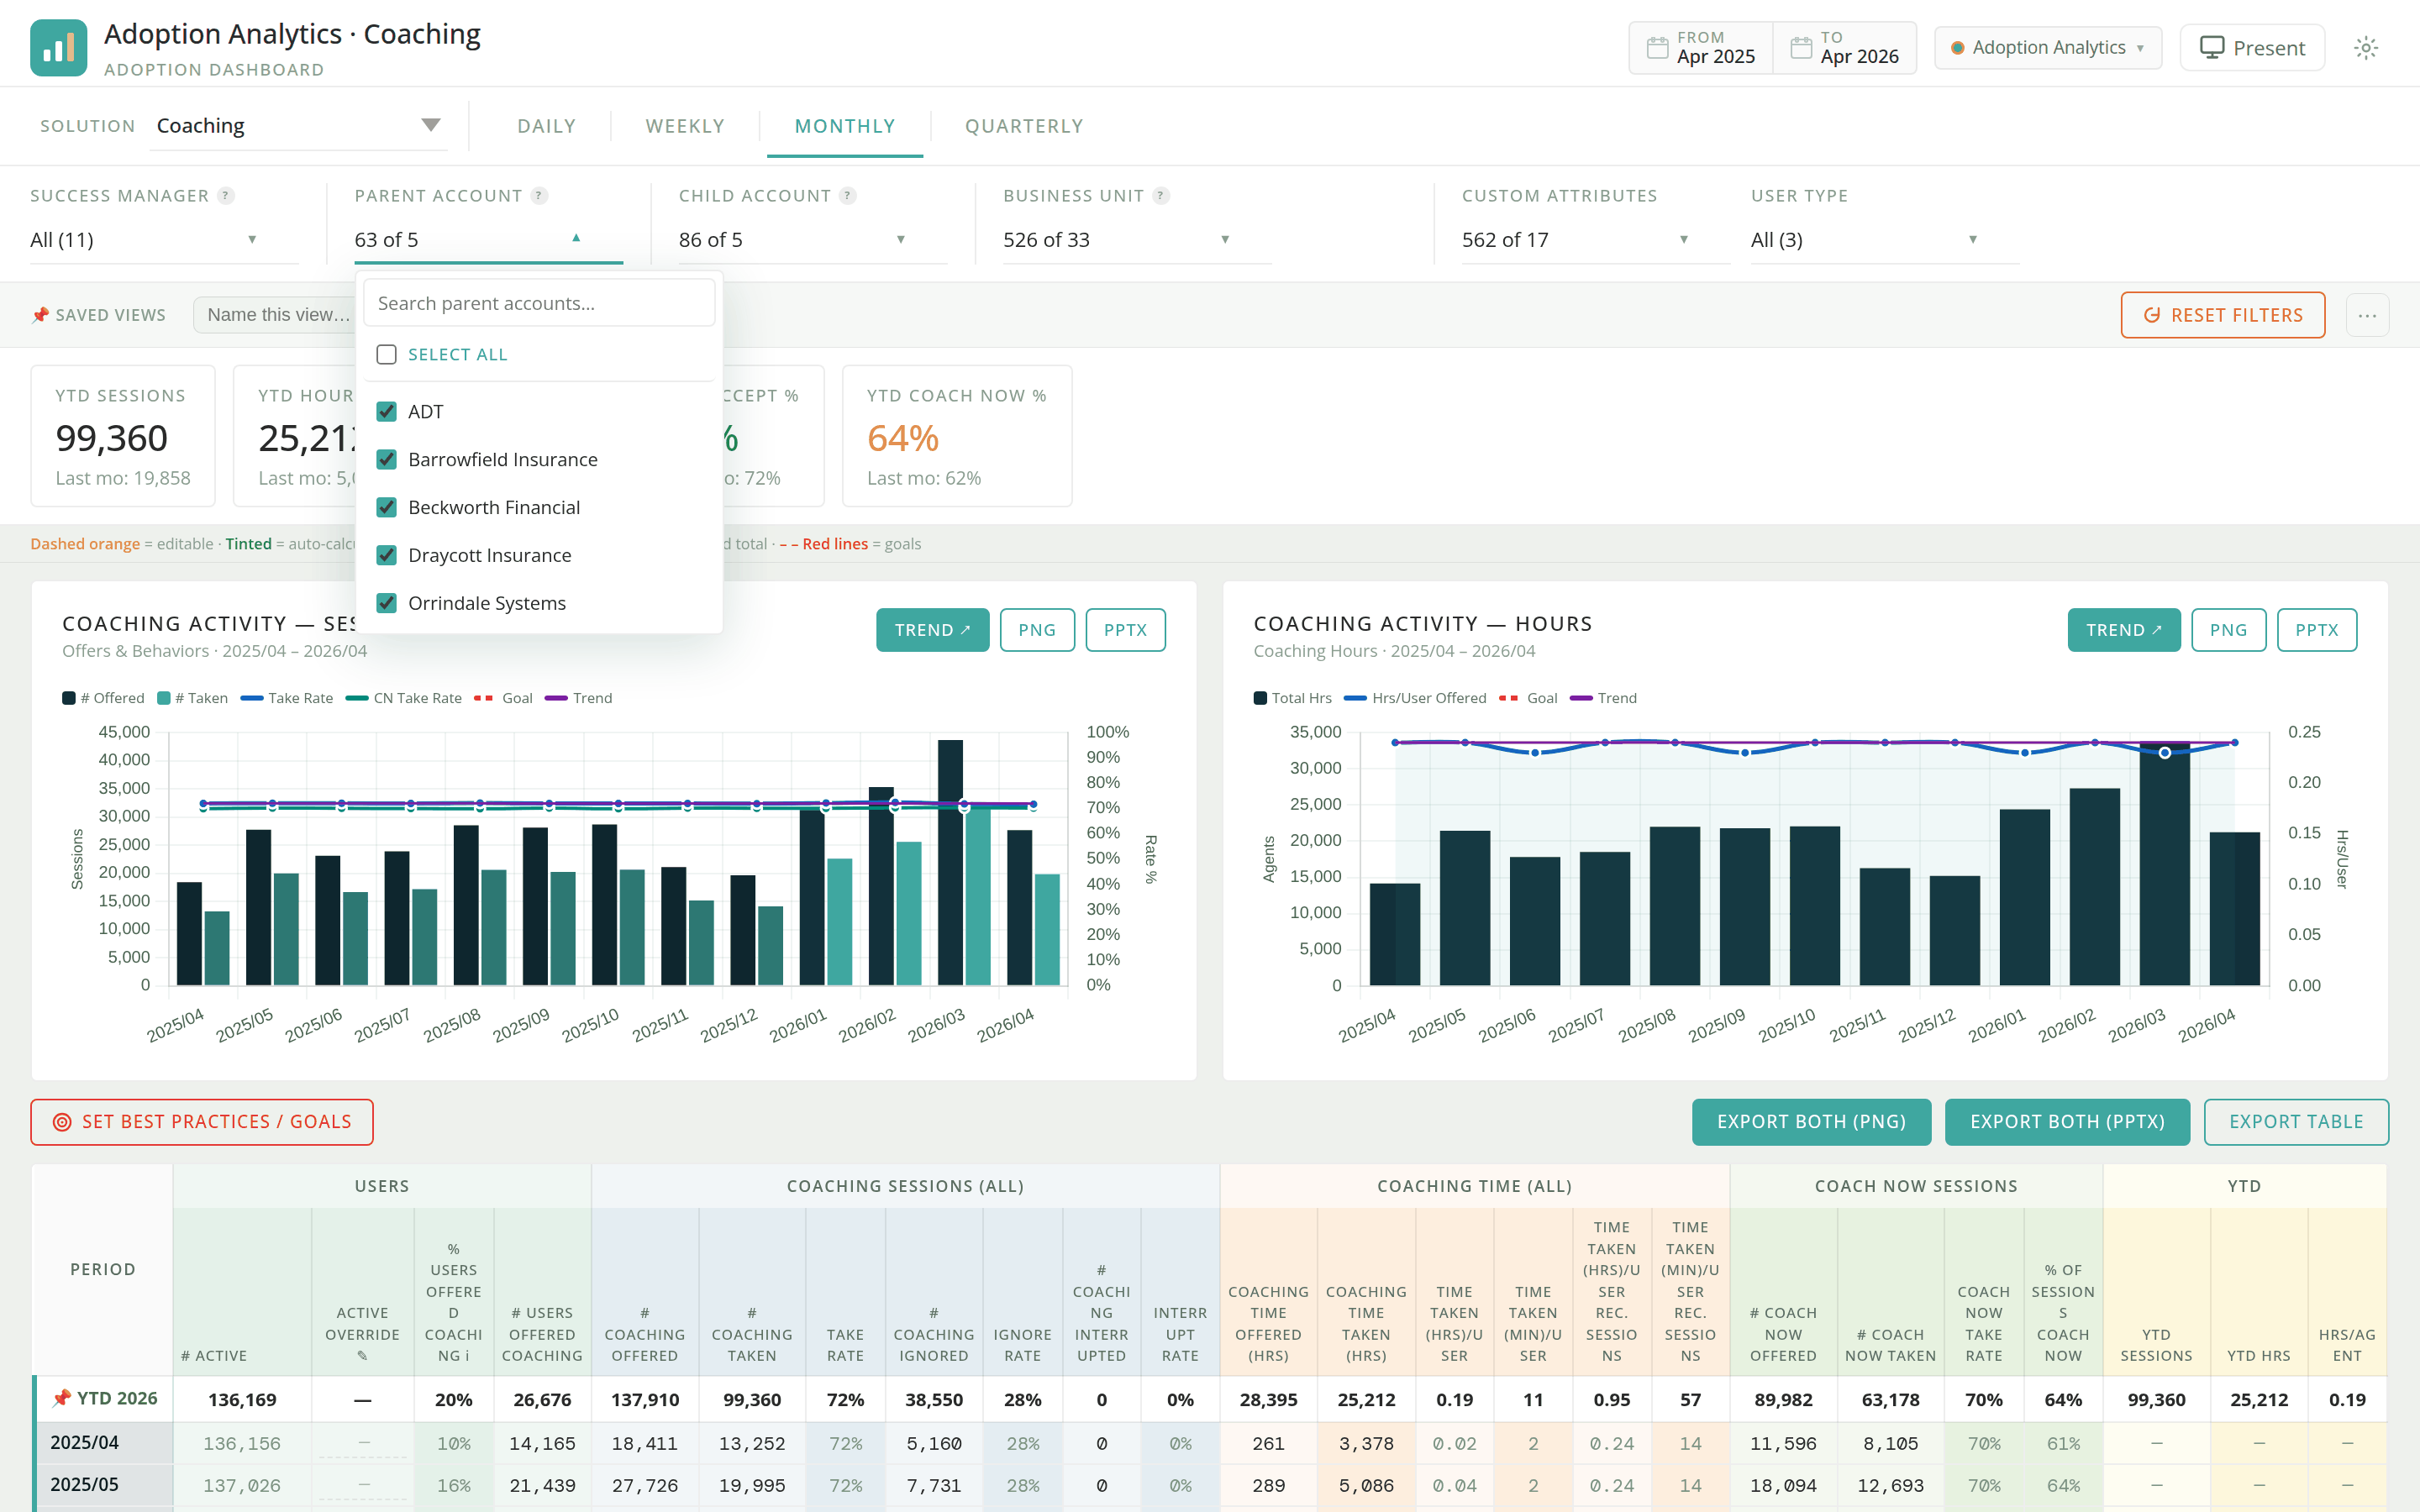
Cascading scope in effect: one manager selected, downstream counts narrowed to "63 of 5", "86 of 5", "526 of 33", with the account picker open.

Cascading scope in effect: one manager selected, downstream counts narrowed to "63 of 5", "86 of 5", "526 of 33", with the account picker open.

What was anonymized

As above. Visible account names are synthetic; the manager whose scope is applied is a synthetic identity.

I surveyed an undocumented BI estate across two instances and wrote the reference documentation the team now works from.

162custom dashboard blocks inventoried

The estate was large enough that changing any shared block risked breaking pages nobody had listed. The inventory is what made blast radius knowable before an edit.

Computed from source
How this was derived
What this basis means
Derived by counting the artifact itself — files, lines, checks, assets. Reproducible by anyone with repository access.
Working
Count of block entries in the production manifest captured from the live instance on 2026-07-27, cross-checked against the page-to-block map compiled during the survey.
Caveat
A point-in-time count. The estate was pruned the same evening, so any later count will be lower. It counts blocks that exist, including ones placed on no page.
Who can confirm
Portal administrator on the client side.
As of
2026-08-06
53pages inventoried

Page count alone understates the work: navigation was driven by tags rather than layout order, so the structure had to be reconstructed rather than read off.

Computed from source
How this was derived
What this basis means
Derived by counting the artifact itself — files, lines, checks, assets. Reproducible by anyone with repository access.
Working
Count of layout entries in the same production manifest, 2026-07-27.
Caveat
Point-in-time; reduced by a subsequent prune. Includes empty and test pages.
Who can confirm
Portal administrator on the client side.
As of
2026-08-06
51datasources inventoried

Establishing that most were pass-through reads is what justified keeping business logic in the ETL layer instead of letting it spread into dashboard SQL.

Computed from source
How this was derived
What this basis means
Derived by counting the artifact itself — files, lines, checks, assets. Reproducible by anyone with repository access.
Working
Count of datasource entries in the same production manifest, 2026-07-27.
Caveat
Point-in-time. Includes two static datasources holding hardcoded values and one duplicate registered under a bare identifier.
Who can confirm
Portal administrator on the client side.
As of
2026-08-06
Evidence
  • artifactEstate mapnot public

    A doc set covering business context, warehouse and lineage, ETL jobs, and a complete page-to-block map with per-page access restrictions. Written from a live survey of both instances, not from prior handover material, because none described the current state.

    Client engagement under commercial confidentiality.

  • artifactPoint-in-time manifestnot public

    A machine-readable manifest of every page, block and datasource, used later as the baseline for a before/after comparison.

    Client engagement under commercial confidentiality.

Where it applied
  • A shared block appeared on seven pages; the map showed the blast radius before anyone edited it.
  • Onboarding a second engineer onto the estate without a verbal handover.
What it implies

I will map an unfamiliar system and write down what I find before I change it, and the map is good enough for someone else to work from.

I held block code to the platform contract the production instance actually runs, rather than the one the vendor's current documentation and tooling assume.

2minor platform versions between the production instance and the contract its authoring tooling assumes

The gap is the whole risk. Tooling that auto-repairs blocks toward the newer contract will produce code that reads no data on the live instance, and the failure is silent rather than an error.

Measured
How this was derived
What this basis means
Recorded directly from instrumentation, timings, or logs at the time the work was done.
Working
Version string read directly from the live production instance via its management API (1.17.2), compared with the version targeted by the authoring client and its documentation (1.19).
Caveat
Correct as at the last check during the engagement; an upgrade would close the gap. The count is of minor versions, not of breaking changes, and one contract change (positional rows to a nested query-results object) does most of the damage.
Who can confirm
Portal administrator on the client side.
As of
2026-08-06
Evidence
  • artifactVersion lock notenot public

    A written constraint recording the deployed version, the data-access shape it implies, and an explicit instruction not to 'modernise' the contract. Includes the reasoning, so the next person can tell a real requirement from a stale preference.

    Client engagement under commercial confidentiality.

  • artifactAutomated guardnot public

    A pre-write hook that flags newer-contract data-access patterns in block code before they reach the production instance, and applies the inverse rule to files targeting a newer sandbox clone.

    Client engagement under commercial confidentiality.

Where it applied
  • A block returning undefined for every field, where the documented fix would have been wrong for this deployment.
  • Preventing an assistant or a well-meaning teammate from auto-upgrading legacy blocks that were working correctly.
What it implies

I check what a system actually runs before trusting its documentation, and I encode that constraint so it survives me.

I converted a mock-data dashboard prototype into portal blocks by replacing only the data-access layer, leaving the calculations and markup intact.

29columns in the primary metrics table, under 7 grouped headers

Width is why the seam mattered. Re-deriving 29 columns against a new data source by hand would have introduced arithmetic differences nobody could audit against the prototype.

Computed from source
How this was derived
What this basis means
Derived by counting the artifact itself — files, lines, checks, assets. Reproducible by anyone with repository access.
Working
Counted cells in a rendered table body row in the running build (29), and header-group cells in the first header row (7).
Caveat
Counts the monthly view of one solution pane; a second pane has its own table of similar width. Column count varies if the currently hidden metric breakout is enabled.
Who can confirm
Success-management lead who specified the columns.
As of
2026-08-06
526business units resolvable through the filter model

Filters cascade, so a selection at manager level has to narrow accounts and business units consistently. This is the size of the set that has to stay coherent on every change.

Computed from source
How this was derived
What this basis means
Derived by counting the artifact itself — files, lines, checks, assets. Reproducible by anyone with repository access.
Working
Read the length of the business-unit collection in the running build; cross-checked against the count the filter control displays in the captured screenshot.
Caveat
Most are placeholder units generated per account pending a real unit feed; two accounts carry their real unit taxonomy. The figure is the addressable set, not a count of units with live data.
Who can confirm
Success-management lead.
As of
2026-08-06
18months in the reporting window

Long enough to need prior-year comparison and trend fitting rather than simple period-over-period, which is what drove the dual-axis chart design.

Computed from source
How this was derived
What this basis means
Derived by counting the artifact itself — files, lines, checks, assets. Reproducible by anyone with repository access.
Working
Length of the month-label array in the running build.
Caveat
Fixed window in the prototype; production sources the grain from the query instead.
Who can confirm
Success-management lead.
As of
2026-08-06
Evidence
  • artifactAdoption dashboardnot public

    A coaching-adoption dashboard with cascading filters, two linked charts, an editable table, saved views and slide export. Screenshots in this capture are a local build of the same code with synthetic data.

    Client engagement under commercial confidentiality.

  • artifactConversion guidenot public

    A written boundary identifying the single seam where mock data enters, the row schema every downstream consumer expects, and which formulas may move server-side versus which must stay client-side.

    Client engagement under commercial confidentiality.

Where it applied
  • Account managers reviewing coaching adoption per business unit ahead of a customer review.
  • Correcting an inflated automated headcount by hand without breaking every per-agent ratio on the page.
What it implies

I look for the one seam that lets a working system keep working, rather than rewriting what already behaves correctly.

I recorded governance defects with a verifiable before-and-after rather than quietly deleting them.

46blocks removed in the cleanup (162 before, 116 after)

Both ends of the change are recorded, so the reduction can be checked rather than taken on trust. Dead blocks matter because several were near-identical copies of live ones, which is how the wrong copy gets edited.

Computed from source
How this was derived
What this basis means
Derived by counting the artifact itself — files, lines, checks, assets. Reproducible by anyone with repository access.
Working
Set difference between the block list in the pre-prune manifest (162) and the verbatim live listing taken after the prune (116), recorded in the prune-mirror file with both source timestamps.
Caveat
The mirror records what changed, not who changed it or whether every removal was mine. Some blocks that look orphaned are loaded programmatically by a parent block, so the review flagged them for verification instead of deletion.
Who can confirm
Portal administrator on the client side.
As of
2026-08-06
10pages removed in the same cleanup (53 before, 43 after)

Confirms the prune touched navigation as well as orphaned content, which is the part users would have noticed if it went wrong.

Computed from source
How this was derived
What this basis means
Derived by counting the artifact itself — files, lines, checks, assets. Reproducible by anyone with repository access.
Working
Set difference between layout entries in the pre-prune manifest and the post-prune live listing, from the same mirror file.
Caveat
Same authorship caveat as above. Includes at least one page that was empty and one test page.
Who can confirm
Portal administrator on the client side.
As of
2026-08-06
Evidence
  • artifactFindings write-upnot public

    A governance review listing dangling block placements, orphaned blocks, duplicated models, static datasources frozen with hardcoded values, and an empty page — each with a remediation order and an explicit instruction not to act without owner sign-off.

    Client engagement under commercial confidentiality.

  • artifactPrune mirrornot public

    A machine-readable diff of the estate before and after a cleanup, computed by subtracting the live listing from the earlier manifest, so the change is auditable rather than asserted.

    Client engagement under commercial confidentiality.

Where it applied
  • Deciding whether a block that appears unused can safely be deleted, when some are loaded dynamically and never appear in a page map.
  • Giving an owner a reversible, checkable record of a cleanup instead of an untraceable one.
What it implies

I flag problems in someone else's system and let the owner decide, and I leave evidence that makes the change auditable.

I extracted a data dictionary and lineage set from the ETL instance to replace tribal knowledge about what the warehouse columns mean.

10,693column-level dictionary entries profiled

At this scale the dictionary has to be generated and regenerable. A hand-maintained one would be wrong within a release, which is how the undocumented state arose in the first place.

Computed from source
How this was derived
What this basis means
Derived by counting the artifact itself — files, lines, checks, assets. Reproducible by anyone with repository access.
Working
Data rows in the Dictionary sheet: 10,697 total rows minus 4 non-data rows (three title/blank rows plus one column-header row), confirmed by inspecting the first five rows of the sheet.
Caveat
Counts columns profiled, not columns in active use — the warehouse carries stale schemas from a dead integration, and those columns are included in the count.
Who can confirm
Analytics engineering lead on the client side.
As of
2026-08-06
350lineage relationships captured

Lineage is what let a dashboard number be traced back to the job that produced it, which the estate could not do before.

Computed from source
How this was derived
What this basis means
Derived by counting the artifact itself — files, lines, checks, assets. Reproducible by anyone with repository access.
Working
Data rows in the Lineage sheet: 354 total rows minus the same 4 non-data rows.
Caveat
Derived from job definitions and output tables; relationships inferred rather than declared by the source systems, so it is a strong starting map rather than a guarantee.
Who can confirm
Analytics engineering lead on the client side.
As of
2026-08-06
303curated model terms

The smallest number here is the one that took judgement: reducing thousands of columns to a few hundred agreed terms is what makes a semantic layer usable.

Computed from source
How this was derived
What this basis means
Derived by counting the artifact itself — files, lines, checks, assets. Reproducible by anyone with repository access.
Working
Data rows in the Semantic Model sheet: 307 total rows minus the same 4 non-data rows.
Caveat
Several central terms remained unconfirmed with the business at the time of extract and were explicitly marked as open questions rather than guessed.
Who can confirm
Analytics engineering lead on the client side.
As of
2026-08-06
Evidence
  • artifactSemantic extractnot public

    Workbooks holding a per-column dictionary profiled from live data (type, row count, null share, distinct share), a lineage set, and a curated term list, generated by a re-runnable script rather than hand-compiled.

    Client engagement under commercial confidentiality.

Where it applied
  • Answering what a metric means without asking the one person who remembers.
  • Identifying which warehouse schemas were stale because an upstream integration had silently stopped authenticating.
What it implies

I prefer generated, re-runnable documentation over hand-written documentation that goes stale, and I mark what I do not know instead of filling the gap.

16

media channels the worksheet can constrain in a single run

Marketing-mix budget optimiser

Delivered for a marketing-mix-modelling vendor serving enterprise advertisers.

Client-confidentialAnalytics Implementation Manager · 2026 (Jun–Aug)7 metrics · 5 screenshotssee the proof ▾

Offered as proof of: Client-facing analytics delivery: turning an operational question into an interface non-analysts use daily.

  • Zuar Portal
  • JavaScript
  • ECharts
  • SQL
  • Snowflake

Interface

Real interface, synthetic data — every value replaced before capture

Custom interactive attribution view — incremental vs other attribution donut, conversion units by channel, ROAS by channel with a breakeven marker; slices and labels are click-to-drill

Custom interactive attribution view — incremental vs other attribution donut, conversion units by channel, ROAS by channel with a breakeven marker; slices and labels are click-to-drill

What was anonymized

4 KPI values scaled; three chart instances re-seeded; donut split shifted and renormalised; bar label formatters replaced; axis maxima rescaled; ROAS ratios intentionally unchanged

Budget-response scatter: each point a modelled media mix, with current plan, diminishing-returns "sweet spot" and alternative scenarios called out

Budget-response scatter: each point a modelled media mix, with current plan, diminishing-returns "sweet spot" and alternative scenarios called out

What was anonymized

Scatter series scaled on both axes including the point payloads behind the callout labels; axis ticks follow automatically

Dense campaign-performance landing page: filter bar, KPI strip, and per-platform breakdown cards with campaign-level spend, impressions, clicks and CTR

Dense campaign-performance landing page: filter bar, KPI strip, and per-platform breakdown cards with campaign-level spend, impressions, clicks and CTR

What was anonymized

Heaviest vocabulary mapping of the set — platform, campaign and product-type names genericised, geography chips replaced, all absolute values scaled, ratios preserved

The page that justified the build: per-channel annual budget entry, constrain/release toggles, live "total constrained vs budget" chip, and the three-step run-and-approve workflow

The page that justified the build: per-channel annual budget entry, constrain/release toggles, live "total constrained vs budget" chip, and the three-step run-and-approve workflow

What was anonymized

Wordmark, product name, user email + avatar initial, all spend values and the budget ceiling scaled; input field values rewritten; budget year and step numbers deliberately preserved

Custom dual-axis block: weekly ad spend stacked by channel against conversion units, with a date-range filter and a paged legend

Custom dual-axis block: weekly ad spend stacked by channel against conversion units, with a date-range filter and a paged legend

What was anonymized

KPI values scaled; the stacked bar + line chart re-seeded across all 13 series; sector vocabulary mapped in titles, KPI labels and axis names

I built the planning worksheet that lets a marketing team run the media-mix model themselves, instead of asking the data science team for a scenario and waiting.

16media channels the worksheet can constrain in a single run

The unit of work is a whole annual plan, not one channel at a time — which is why the grid, the payload and the results table all had to stay consistent with each other under partial input.

Computed from source
How this was derived
What this basis means
Derived by counting the artifact itself — files, lines, checks, assets. Reproducible by anyone with repository access.
Working
Counted the channel rows rendered in the worksheet grid (8 rows across 2 columns = 16) and cross-checked against the category count in the live chart state of both the units and ROAS bar charts, each of which carried 16 data points.
Caveat
True as of the August 2026 capture. The channel list is configuration held server-side, so a later model run could carry more or fewer.
Who can confirm
The vendor's analytics lead, who defined the channel list.
As of
2026-08-06
3steps between opening the page and a change taking effect

The approval gate is the product. An unreviewed number must not be able to reach the model, so 'run a simulation' and 'make it permanent' are deliberately separate actions against separate backend paths.

Computed from source
How this was derived
What this basis means
Derived by counting the artifact itself — files, lines, checks, assets. Reproducible by anyone with repository access.
Working
Counted the stages in the shipped workflow stepper: enter constraints, run and review results, make entry fixed. Each maps to a distinct server-side call.
Caveat
Describes the shipped design, not a measurement of user behaviour; I did not instrument how many users complete all three.
Who can confirm
The vendor's analytics lead, who signed off the workflow.
As of
2026-08-06
Evidence
  • artifactConstraint worksheetnot public

    The page users open to set a per-channel annual budget, leave channels for the model to decide, run a simulation, and promote a reviewed result to the approved plan. A three-step stepper carries the workflow; a live total warns before it exceeds the approved budget ceiling.

    Client engagement under commercial confidentiality.

  • artifactResults and optimiser viewsnot public

    The attribution drill-down and budget-response scatter the worksheet's output is read against — incremental contribution, conversion units and ROAS by channel, and the spend level where each extra dollar starts returning less.

    Client engagement under commercial confidentiality.

Where it applied
  • A marketing lead testing whether moving budget out of direct mail changes projected contribution, before committing to it.
  • Locking a negotiated annual spend for two channels and letting the model allocate the rest.
What it implies

I can take a modelling capability that only its authors could operate and turn it into something a business team runs unsupervised, without loosening the controls on what reaches production.

I made a model run that takes minutes survive the user navigating away, so leaving the page stopped meaning losing the run.

36automated checks across three test harnesses covering the persistence and recovery paths

This behaviour is untestable by clicking — it needs a killed page, a stale record, another user's record and a clock skew. The harness is what made the edge cases reproducible instead of anecdotal.

Computed from source
How this was derived
What this basis means
Derived by counting the artifact itself — files, lines, checks, assets. Reproducible by anyone with repository access.
Working
Counted check() call sites in the three harness files with grep -c: resume 21, draft-capture 6, committed-rows 9 = 36.
Caveat
Counted statically from source rather than re-executed during this capture — the harnesses boot the block in jsdom, which is not installed in the capture environment. The last recorded full green run was my own during the build, so this is self-reported, not independently verified.
Who can confirm
None — self-reported from my own build log.
As of
2026-08-06
90seconds of grace before an unacknowledged run is treated as never having landed

Without this threshold the only honest options were to show a fifteen-minute timeout for a run that never started, or to discard a run that was merely slow to be acknowledged. The window separates the two.

Computed from source
How this was derived
What this basis means
Derived by counting the artifact itself — files, lines, checks, assets. Reproducible by anyone with repository access.
Working
Read directly from the shipped configuration constant governing the queue-acknowledgement window (QUEUE_ACK_MS = 90000 ms).
Caveat
Chosen against observed queue-acknowledgement latency of a few seconds, with generous headroom; it is a judgement call, not a value derived from a measured distribution.
Who can confirm
The client's database administrator, who described the queue's acknowledgement behaviour.
As of
2026-08-06
Evidence
  • artifactRun-recovery verificationnot public

    Browser storage holds only a run id. On return, one read of the queue and run tables decides between four outcomes — never landed, still running, hung past the ceiling, or finished while away — because a record written by a tab that may have been killed mid-write cannot be trusted to say which.

    Client engagement under commercial confidentiality.

  • artifactDraft-persistence fixnot public

    Typed values are flushed synchronously on pagehide and on tab-hide, because the platform navigates with a full page load and the debounce window swallowed the last edit before it could be written.

    Client engagement under commercial confidentiality.

Where it applied
  • Starting a simulation, moving to another page to check current performance, and coming back to live progress rather than an empty form.
  • Closing the tab mid-run and still finding the completed result on return.
What it implies

I design for the failure modes that only show up in real use — page teardown, background-tab timer throttling, two tabs sharing one browser — rather than for the happy path a demo exercises.

I found and fixed a filter that made two production queries return nothing at all, which was blocking launch.

0 → 2 and 0 → 5rows returned by the prefill and history queries, before and after the fix

A silent empty result is the failure mode that gets shipped, because the page renders perfectly — it just shows an empty plan. The before number is the whole point: the feature looked finished and returned nothing.

Measured
How this was derived
What this basis means
Recorded directly from instrumentation, timings, or logs at the time the work was done.
Working
Ran both queries against production on 2026-07-31 and recorded returned row counts: prefill 0 before / 2 after; history 0 before / 5 after, spanning 3 approved groups.
Caveat
The 'after' magnitudes depend on how many constraint sets had been approved at that moment, so they are not a measure of scale — only the transition from zero is meaningful. Both counts are my own observation.
Who can confirm
The client's database administrator, who owns the approval procedure that populates these tables.
As of
2026-08-06
Evidence
  • artifactApproved-set querynot public

    The prefill and history queries keyed off a scenario naming convention. Once the UI began naming every run with that prefix, the exclusion matched everything and both returned zero rows — with no error. Rewritten to key off the approval table and to order by approval time rather than creation time, so the grid and its history cannot disagree about which set is current.

    Client engagement under commercial confidentiality.

Where it applied
  • A returning user seeing the constraints their organisation already approved, rather than a blank grid.
  • Reading the history of what changed between two approved plans, and who approved them.
What it implies

I check that a query returns what it should on real data, not merely that it runs — the defects that survive to production are usually the ones that do not raise an error.

I kept the front end shipping while the backend contract was replaced three times, and reported the failures precisely enough that the other team could act on them.

3distinct backend entry points the UI was wired to in turn before one worked end to end

Most of the elapsed time on this build was not spent writing the UI. It was spent isolating whose layer was failing and giving the other team something reproducible — which is the work that actually unblocked it.

Computed from source
How this was derived
What this basis means
Derived by counting the artifact itself — files, lines, checks, assets. Reproducible by anyone with repository access.
Working
Counted the distinct server-side entry points implemented against, in order: a direct asynchronous stored-procedure call, a synchronous procedure variant, and the request-queue insert that shipped. Each is a separate dated entry in my build log.
Caveat
From my own build log. Each change was driven by the client's database owner altering or withdrawing the interface, not by my preference — I am counting externally imposed changes, and only my own record establishes the sequence.
Who can confirm
The client's database administrator, who specified each replacement.
As of
2026-08-06
15dated entries in the build log across the engagement

Indicates how much of this work was iterative diagnosis against a moving backend rather than a single implementation pass.

Computed from source
How this was derived
What this basis means
Derived by counting the artifact itself — files, lines, checks, assets. Reproducible by anyone with repository access.
Working
Counted dated section headings matching the '## YYYY-MM-DD' pattern in the build log: 15, spanning 2026-07-13 to 2026-07-31.
Caveat
Entries are written at my discretion, so this counts recorded working sessions rather than total effort, and the span excludes undated earlier work.
Who can confirm
None — self-reported from my own build log.
As of
2026-08-06
Evidence
  • artifactDated build lognot public

    A running record of each backend contract the UI was wired to, what broke, and the evidence that located the fault — including a transaction-semantics failure that was reproduced in the browser and timed to distinguish it from a permissions error.

    Client engagement under commercial confidentiality.

  • artifactReproducible-statement loggernot public

    Every submission logs a copy-pasteable warehouse statement for the exact payload sent, so a failed run could be handed to the database owner as something they could execute directly rather than as a description.

    Client engagement under commercial confidentiality.

Where it applied
  • Handing a database owner an executable statement reproducing a failure, instead of a screenshot of an error.
  • Distinguishing a permissions failure from a transaction-semantics failure by timing the call.
What it implies

I am useful on the seam between teams: I can hold a delivery together while the interface underneath it changes, and make the other side's problem legible enough to fix.

124

blocks audited

Publisher royalty and sales reporting

Delivered for a media licensing and reprint-rights business that reports sales and royalty activity back to its publisher partners.

Client-confidentialAnalytics Implementation Manager · 202610 metrics · 3 screenshotssee the proof ▾

Offered as proof of: Client-facing analytics delivery: turning an operational question into an interface non-analysts use daily.

  • Zuar Portal
  • JavaScript
  • ECharts
  • amCharts
  • SQL
  • PostgreSQL
  • Tableau

Interface

Real interface, synthetic data — every value replaced before capture

The landing dashboard a publisher sees on sign-in: tenant greeting, six headline KPI cards, a YTD sales gauge and a vertical-revenue bullet chart. This is the page that justified the build. 769×1378.

The landing dashboard a publisher sees on sign-in: tenant greeting, six headline KPI cards, a YTD sales gauge and a vertical-revenue bullet chart. This is the page that justified the build. 769×1378.

What was anonymized

Wordmark, tenant name, all six KPI values, gauge axis, bullet-chart percentages. Category labels left intact — they are generic industry verticals, not client IP.

A metrics page whose bar and donut charts are hand-written ECharts blocks replacing native widgets that rendered blank, plus the paginated detail table and the rebuilt CSV export button. 769×1224.

A metrics page whose bar and donut charts are hand-written ECharts blocks replacing native widgets that rendered blank, plus the paginated detail table and the rebuilt CSV export button. 769×1224.

What was anonymized

Wordmark, tenant name, 98 distinct entity names, all currency and percentage values, both charts rewritten through the ECharts API.

Close detail of the dashboard header and KPI treatment, rendered at 2× for a crisp crop. 1473×660.

Close detail of the dashboard header and KPI treatment, rendered at 2× for a crisp crop. 1473×660.

What was anonymized

Wordmark, tenant name, KPI values.

I audited every block in a live client portal before changing any of it, and classified which ones actually needed migrating.

124blocks audited

The audit covered the whole portal rather than the pages someone had already complained about, so the migration scope was derived rather than assumed.

Computed from source
How this was derived
What this basis means
Derived by counting the artifact itself — files, lines, checks, assets. Reproducible by anyone with repository access.
Working
Count of block records in the pre-change snapshot export (one JSON file per block); re-counted from the version-control mirror as 124 files.
Caveat
Counts blocks as stored, including blocks not placed on any page. A block placed on several pages still counts once.
Who can confirm
Verifiable from the snapshot commit by anyone with repository access.
As of
2026-08-06
17blocks using the superseded data-access pattern

Most of the portal was already safe; identifying the minority that was not is what kept the change surface small.

Computed from source
How this was derived
What this basis means
Derived by counting the artifact itself — files, lines, checks, assets. Reproducible by anyone with repository access.
Working
Scripted classification of the 60 script-bearing blocks in the snapshot, then a manual second pass. The second pass corrected two misclassifications the pattern match missed: one block that read the deprecated fields via a destructuring alias, and one that passed the whole scope object into a helper which read them internally.
Caveat
Pattern matching alone under-counted; the corrected figure depends on the manual re-read being complete. Blocks with no script cannot carry the pattern and were excluded by definition.
Who can confirm
Reviewed by the engineer who commissioned the migration.
As of
2026-08-06
10in-scope blocks, of the 17 found

Seven of the affected blocks were not placed on any page, so migrating them would have been change without benefit; the client chose to leave them.

Computed from source
How this was derived
What this basis means
Derived by counting the artifact itself — files, lines, checks, assets. Reproducible by anyone with repository access.
Working
Of 17 flagged blocks, 10 appeared in a page layout grid and 7 did not. Placement determined by cross-referencing block IDs against all 18 layout definitions.
Caveat
Placement was read from layout grids. One block was later found to execute on a page without appearing in any grid, because it is injected another way — so grid-based placement slightly under-reports what actually runs.
Who can confirm
Client-side decision recorded in the migration log.
As of
2026-08-06
Evidence
  • artifactPre-change snapshotnot public

    A full export of the portal committed to a dedicated version-control mirror before the first edit, used as the classification source of truth and as the rollback point.

    Client engagement under commercial confidentiality.

  • artifactPer-block dossiernot public

    A written record for each candidate block: the legacy pattern found, line references, its data binding verbatim, a conversion sketch, and a risk rating.

    Client engagement under commercial confidentiality.

Where it applied
  • Inheriting an undocumented portal and needing to know what will break on an upgrade before committing to a date.
  • Justifying to a client why 114 of their 124 blocks should be left alone.
What it implies

I scope from evidence rather than from the symptom that was reported, and I am willing to argue for a smaller change than the one I was asked for.

I found and worked around four defects in the portal build that made the documented migration pattern fail silently.

4platform defects root-caused

Each one produced a blank panel or an empty file with a clean console, so none of them would have been found by watching for errors.

Computed from source
How this was derived
What this basis means
Derived by counting the artifact itself — files, lines, checks, assets. Reproducible by anyone with repository access.
Working
Count of distinct defects documented with a reproduction and a workaround in the migration log: (1) the block scope accessor returns a fresh detached snapshot per call, so polling the captured object never observes data; (2) some queries deliver rows with empty stored column metadata, so a columns-based readiness test can never pass; (3) the range-filter setter stores start/end keys, not the min/max keys the migration guide documents; (4) the auto-refreshing filter setters emit no load event, so loading indicators tied to that event never clear.
Caveat
These are defects as observed on this portal build and version; I did not test whether they persist in later releases. Defects (2) and (3) were confirmed against live data; (1) was confirmed by reading the vendor bundle and by in-page experiment.
Who can confirm
Reproductions recorded in the migration log for the maintaining engineer.
As of
2026-08-06
Evidence
  • artifactReadiness gate implementationnot public

    The block-side gate that re-reads a fresh scope each poll and repairs absent column metadata before rendering. Included in this package as a sanitized code sample.

    Client engagement under commercial confidentiality.

  • artifactVendor bundle reverse-engineering notesnot public

    Notes recording how the portal wraps and invokes each block script, which is what showed that the object handed to the script is a detached snapshot rather than a live reference.

    Client engagement under commercial confidentiality.

Where it applied
  • A dashboard renders blank on first load but works when you refresh, and nothing appears in the console.
  • A documented upgrade path does not work and you need to determine whether the fault is yours or the platform's.
What it implies

When a vendor's documented approach does not work, I will read their shipped code to find out why rather than adding retries until it appears to pass.

I rebuilt six chart panels that the portal's own chart widgets could not render, matching the original appearance.

6native chart widgets replaced with hand-written chart blocks

The underlying cause was a data defect the widgets could not tolerate, so the alternative to rebuilding was editing shared saved queries that other pages also depend on.

Computed from source
How this was derived
What this basis means
Derived by counting the artifact itself — files, lines, checks, assets. Reproducible by anyone with repository access.
Working
Four blocks converted in the first pass and two more found later on pages outside that pass; each conversion is logged with its block ID and a backup of the original.
Caveat
Four were visually verified against the reference portal; two were verified at code level only, because the browser available at the time was not signed in to the portal and I do not enter credentials. Those two are flagged as needing a visual check.
Who can confirm
Sizing and proportion corrections were requested and confirmed by the client after review.
As of
2026-08-06
Evidence
  • artifactRebuilt chart page (anonymized capture)not public

    Screenshot of a page whose bar and donut charts are hand-written ECharts blocks replacing native widgets that rendered blank. Included in this package.

    Client engagement under commercial confidentiality.

  • artifactChart sizing and disposal codenot public

    The run-time cell measurement and dispose-before-init handling that made the replacements sit correctly in a fixed-pixel page grid. Included as a sanitized code sample.

    Client engagement under commercial confidentiality.

Where it applied
  • A stock chart widget silently renders nothing and the data behind it is shared with pages you are not allowed to disturb.
  • Replacing a charting library while having to match the previous rendering closely enough that users do not notice.
What it implies

I would rather rebuild a component in my own code than modify a shared resource other pages depend on, and I will say which parts of my work are verified and which are not.

I fixed a portal-wide CSV export that was silently truncating every download.

50rows returned by the export before the fix, regardless of result size

The download succeeded and opened cleanly, so the truncation would only surface when someone reconciled the file against the report and found it short.

Measured
How this was derived
What this basis means
Recorded directly from instrumentation, timings, or logs at the time the work was done.
Working
Observed live: the export request built with a numeric zero row limit returned exactly 50 rows, the portal's default page size, because the platform deletes a limit that equals zero. The same request with the limit expressed as a string returned the full result set (over 1,200 rows on the page tested).
Caveat
The 50-row figure is the platform's default page size on this build and would differ if that default were configured differently. The full-result figure varies per page and per active filter.
Who can confirm
Behaviour re-tested on a second report page by the same route.
As of
2026-08-06
11pages carrying the affected export button

A single shared block meant one defect and one fix propagated across most of the portal's reporting surface.

Computed from source
How this was derived
What this basis means
Derived by counting the artifact itself — files, lines, checks, assets. Reproducible by anyone with repository access.
Working
Count of distinct page layouts whose grid references this block's ID, taken from the pre-change snapshot.
Caveat
Counts placements, not usage; I did not instrument how often the button was pressed on each page.
Who can confirm
Verifiable from the snapshot commit.
As of
2026-08-06
Evidence
  • artifactExport query constructionnot public

    The code that resolves the visible table's saved query, prunes fields the API rejects, and sets the row limit in the one form the backend honours. Included as a sanitized code sample.

    Client engagement under commercial confidentiality.

  • artifactLive click testsnot public

    Before-and-after exercises of the button on two different report pages, checking the exported column shape and that an active filter was honoured.

    Client engagement under commercial confidentiality.

Where it applied
  • An export that silently returns the first page of results instead of the whole set.
  • Needing a downloaded file to agree exactly with the filtered table the user is looking at.
What it implies

I treat a quiet wrong answer as more serious than a loud failure, and I verify a fix by measuring the output rather than by confirming the absence of an error.

I validated a year-over-year reporting design against live systems without modifying anything the client was already using.

2US dollars of difference between the new by-year figures and the existing production total

A near-exact match established that the new query path reproduced the existing one, including its row-level access restrictions, rather than quietly reading a wider or narrower slice of data.

Measured
How this was derived
What this basis means
Recorded directly from instrumentation, timings, or logs at the time the work was done.
Working
The three per-year revenue figures from the new datasource were summed and differenced against the figure the existing production metric returns for the same scope. The residual is rounding: each side rounds to whole dollars at a different stage. The associated opportunity counts matched exactly across all three years, with no residual.
Caveat
Both sides were read as an administrator. A per-publisher user would see a restricted subset, and I verified that the access-restriction join was present in the new path but did not re-run the comparison as a restricted user. The dollar total itself is withheld as client data.
Who can confirm
Figures reproduced through the reporting service's own read path, not only through my query.
As of
2026-08-06
Evidence
  • artifactAdditive proof-of-conceptnot public

    A new scheduled-never transform job, a new derived table, a new datasource, a new block and a new admin-only page — built alongside the live reporting path so that every existing page, block and query was referenced but never altered.

    Client engagement under commercial confidentiality.

  • artifactReconciliation checknot public

    The new by-year figures summed and compared against the existing production total, and the opportunity counts compared across all years, to prove the new path returned the same data through a different route.

    Client engagement under commercial confidentiality.

Where it applied
  • Adding history to a live reporting product where the existing numbers must not move.
  • Proving a data model works before asking anyone to approve rebuilding on top of it.
What it implies

I prove a design on the real system additively, and I reconcile new numbers against the ones people already trust before proposing that anyone switch.

I captured a full visual baseline of both environments before migrating, and used it as the pass condition afterwards.

66baseline page captures

Several pages were already broken before I touched anything, so without a baseline those faults would have been attributed to the migration.

Computed from source
How this was derived
What this basis means
Derived by counting the artifact itself — files, lines, checks, assets. Reproducible by anyone with repository access.
Working
33 pages captured in the working environment plus 33 equivalent pages in the reference environment.
Caveat
Page count exceeds the 18 layouts because some pages were captured in more than one state. Captures were taken over a period during which some pages intermittently failed to finish rendering, and those instances are noted rather than retried to a clean result.
Who can confirm
Stored alongside the migration log for the maintaining engineer.
As of
2026-08-06
10migrated blocks verified in a running page

Verification was per block in the page it actually runs on, rather than a single smoke test of the site, which is what caught the blocks that only failed on the pages where they were hidden by default.

Computed from source
How this was derived
What this basis means
Derived by counting the artifact itself — files, lines, checks, assets. Reproducible by anyone with repository access.
Working
Count of rows in the post-migration verification matrix, each naming the page checked and the observed result. Every in-scope block has a row.
Caveat
Verification was visual and console-based in a browser, not automated, so it establishes that each block rendered and behaved correctly at the time it was checked, not that it will under all filter states.
Who can confirm
Client reported two further broken panels afterwards on pages outside the migration scope, which were then fixed — so the matrix reflects the scope checked, not the whole portal.
As of
2026-08-06
Evidence
  • artifactBaseline capture setnot public

    Full-page captures of every page in both the working environment and the reference environment, with written per-page notes on what was already broken in each.

    Client engagement under commercial confidentiality; the captures contain live client data and were not anonymized.

  • artifactPost-migration verification matrixnot public

    A row per migrated block recording where it was checked and what was observed, including the blocks that were already broken before the work started.

    Client engagement under commercial confidentiality.

Where it applied
  • Migrating someone else's system where you will be blamed for every fault discovered afterwards.
  • Distinguishing pre-existing breakage from breakage you introduced.
What it implies

I establish what 'working' meant before I start, so that afterwards the question of whether I broke something is a matter of record rather than argument.

Image Trainer — a LoRA training workbench

A local AI workbench: LoRA creation for image and video, image-to-text, speech-to-text, text-to-speech, image and video generation, and a custom agent driving it — running on local models.

Source not publicSole author · 20260 metricssee the proof ▾

Offered as proof of: Hands-on work below the API line. Fine-tuning, multimodal pipelines, and local inference, rather than only orchestrating hosted endpoints.

  • Python
  • LoRA training
  • Local LLMs
  • STT
  • TTS
  • Diffusion
  • Custom agent

I built a local multimodal AI workbench end to end rather than driving someone else’s notebook.

Evidence
  • artifactMultimodal pipelinenot public

    LoRA creation for both image and video, image-to-text, speech-to-text, text-to-speech, image generation and video generation — with a custom agent coordinating them, all running against local models.

    Personal project, not yet published.

  • docArchitecture and design documentationnot public

    Carries its own architecture document, design system, surface map, changelog, and an overnight-run guide — treated as a real project rather than a scratch directory.

    Personal project, not yet published.

Where it applied
  • Training image and video LoRAs locally on a documented, repeatable pipeline.
  • Running an entire multimodal loop — transcribe, describe, generate, narrate — without a hosted API in the path.
What it implies

My AI experience is not limited to calling hosted APIs. I have trained the adapters, run the local models, and built the agent that drives them.

11

public repositories

Public repositories

Small, finished, self-contained tools — the ones anyone can read without asking permission.

Public sourceSole author · 20261 metricsee the proof ▾

Offered as proof of: Code you can actually inspect. Everything else on this page is described; this is shown.

  • Python
  • TypeScript
  • HTML

Where I can publish, I do — and these are deliberately small and finished rather than impressive and abandoned.

6 items you can open and check yourself

11public repositories

Openable without a request, an NDA, or a conversation — including all four MCP servers, published with employer clearance.

Computed from source
How this was derived
What this basis means
Derived by counting the artifact itself — files, lines, checks, assets. Reproducible by anyone with repository access.
Working
gh repo list filtered to public visibility: the four zuar-*-mcp servers plus seven personal repositories. The six listed below are the ones worth reading; the rest are small or superseded.
Caveat
Counts repositories, not projects. Several substantial projects — the game, the training workbench, the home lab — remain private and are described in their own case studies instead.
As of
2026-08-06
Evidence
Where it applied
  • downloads-sorter runs continuously as a systemd service on my own machine.
What it implies

Deliberately unglamorous. Small tools that work, finished and left alone, are a better signal than a large repository last touched two years ago.